Why Crypto Options Dashboards Overwhelm Smart Traders?
You've mastered options theory, but Deribit's dashboard still makes you feel like an idiot. Here's why smart traders freeze up when faced with real market data—and the analytical framework that transforms confusion into profitable clarity.
"Because knowing what a Delta is doesn't prepare you for this mess."
I'll never forget the first time I opened Deribit’s options dashboard. Three weeks earlier, I'd been riding high on YouTube university, absorbing every options trading video I could find. Black-Scholes? Child's play. Greeks? I could rattle off Delta, Gamma, Theta like I was ordering coffee. Put-call parity? Please... that's basic math.
I was ready to conquer the crypto options world. Then I clicked that fateful "Options" tab.
What greeted me wasn't the clean, educational examples from YouTube. Instead, I found myself staring at what can only be described as a numerical hurricane. Look at this screenshot I grabbed from a typical Deribit session:
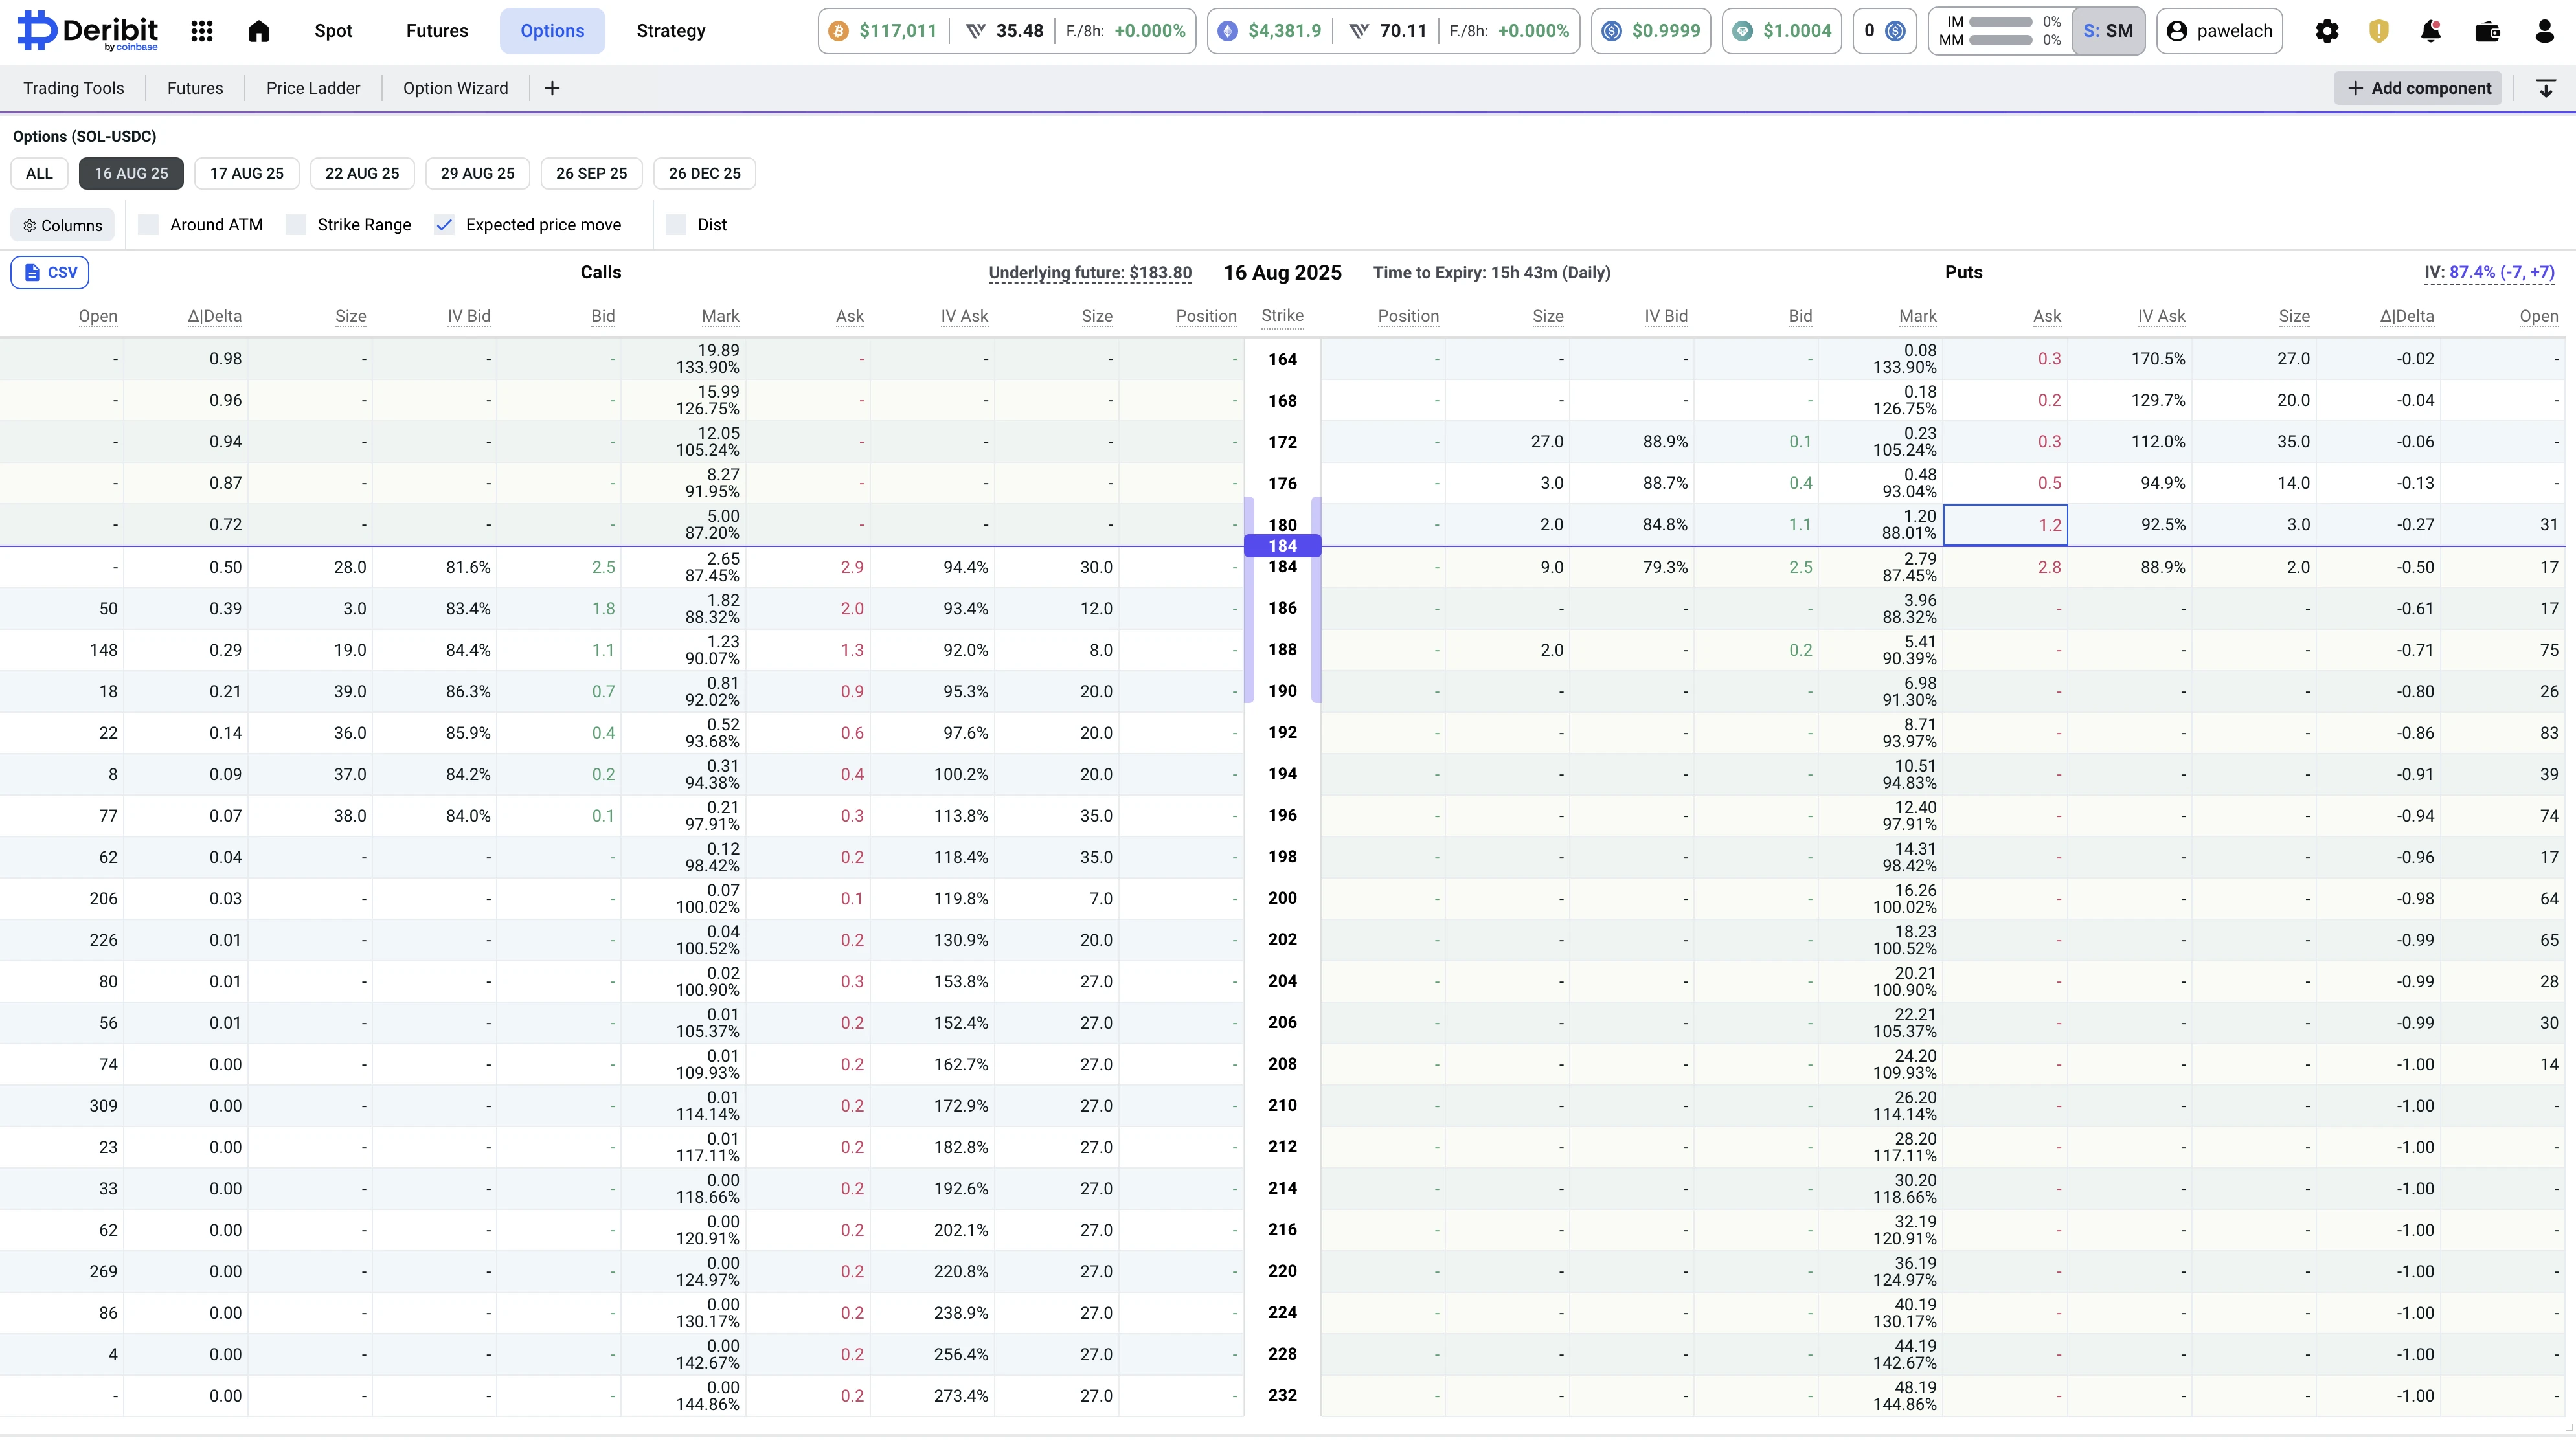
Figure 1: Deribit's Dashboard for Options Trading
My confident smirk vanished faster than Bitcoin during a China ban announcement. This wasn't the neat, theoretical world of educational videos. This was raw, unfiltered market chaos served up in spreadsheet form.
The Smart Trader's Paradox
Here's what nobody tells you about options trading: the smarter you are, the more this dashboard will mess with your head. You see, if you were completely clueless, you might just pick something random and hope for the best. But because you've done your homework and because you understand the concepts, you know there's a "right" answer hiding somewhere in this maze of numbers. You just can't find it. Looking at that screenshot again, your brain starts firing on all cylinders!
The underlying is at $183.80, but there are strike prices everywhere from 164 to 232. Some show decent volume, others are trading tumbleweeds. The implied volatilities (IV) are bouncing around. Bid-ask spreads range from reasonable to "are you kidding me?" And time? Don't even get me started on time. With expiration just hours away, every minute you spend analyzing is literally money evaporating from potential positions...
When Theory Crashes Into Reality
The educational videos make it sound so straightforward. "If you think the stock will go up, buy a call options. If you think volatility is too high, sell premium." Simple, right?
But reality is like trying to apply driving lessons in a demolition derby. Sure, you know how to steer and brake, but nobody prepared you for the chaos.
Take implied volatility, for instance. In theory, you learned that high IV means expensive options and low IV means cheap ones. Great! But what's "high" when you're looking at crypto? Traditional stocks might see 30% IV during earnings season, but crypto options regularly cruise above 100% like it's nothing special. That 94.4% IV you see in the screenshot - is that expensive or just Tuesday?
The Greeks present their own special torture. You memorized that Delta measures price sensitivity, but seeing a 0.84 Delta in the wild feels different. Is that good? Bad? Should you be excited or terrified? The educational content never covered the emotional roller coaster of translating Greek letters into actual money at risk!
The Volume Puzzle That Breaks Brains
Here's where things get really fun! Volume analysis in crypto options is completely uncharted territory. Traditional markets have clear volume patterns. Options on Apple or Tesla stocks show predictable liquidity curves. But crypto?!
Look at that dashboard again. Some strikes show solid volume, others show zero activity. What constitutes "liquid" in this crypto-options market? Is 30 contracts decent volume or thin ice? How do you interpret open interest when the entire market is still finding its feet?
These questions don't have clean YouTube-friendly answers because the market itself is still writing the rules.
I spent my first weeks paralyzed by volume analysis. Every time I found a strike that looked theoretically attractive, I'd notice the volume was pathetic! When I found decent volume, the Greeks looked terrible! It's like the market was designed specifically to frustrate logical analysis.
The Analysis Paralysis Death Spiral
This is where most smart traders get stuck in what I call the "analysis paralysis death spiral." You start by trying to analyze everything systematically. Current implied volatility versus historical norms. Check the Greeks across multiple strikes. Compare volume patterns. Calculate potential profit scenarios. Before you know it, you've spent two hours analyzing a position that expires in six hours.
The cruel irony?
While you're busy being thorough and analytical, the market keeps moving! That perfect setup you identified an hour ago? Think twice! The underlying price has shifted, implied volatility has changed, and your analysis is already stale!
But here's the kicker—you can't just ignore the analysis either. Random trades in options land are expensive education. Really expensive. The bid-ask spreads alone will eat you alive if you're not careful about entry and exit points.
Why Smart People Feel Stupid
The dashboard overwhelm isn't a character flaw — it's a design problem. These interfaces were built by programmers for programmers, not by traders for traders.
They prioritize data completeness over decision-making clarity.
Think about it this way. If I handed you the complete weather data for the past month e.g. temperature readings every 5 minutes, humidity percentages, wind speeds, barometric pressure - could you instantly tell me whether to bring an umbrella today? Probably not. You'd need someone to interpret all that data and tell you "30% chance of rain this afternoon." Right?
That's exactly what's happening with options dashboards. You're getting raw data when what you need is a simple forecast.
The Deribit interface shows you every piece of information available, but provides zero context for making decisions.
The Missing Translation Layer
What's missing isn't more data. In fact, we're drowning in data! What's missing is the translation layer that converts information into insight.
Professional trading firms don't just look at raw Greeks and implied volatilities! They have sophisticated models running in the background, constantly calculating percentile rankings, momentum indicators, and relative value assessments. They have context for every number on the screen.
Retail traders? We get the raw numbers and a prayer!
Not because we wanted to create more complexity, but because we wanted to eliminate the unnecessary complexity that keeps smart traders stuck in analysis mode.
How We Solve the Dashboard Dilemma
Our approach starts with a simple assumption, i.e. every number on that confusing dashboard should tell you something useful about your trading decision, or it shouldn't be there at all.
Instead of showing you that implied volatility is 94.4%, our system automatically calculates where that sits historically. Is it in the 90th percentile of recent readings? The 20th? This context transforms a meaningless number into actionable intelligence.
We've built quality options scoring systems that automatically filter out the noise. Those strikes with terrible bid-ask spreads and zero volume? Our algorithms flag them as untradeable before you waste time analyzing them.
The strikes with solid liquidity and reasonable spreads get highlighted with clear quality indicators.
Our momentum analysis goes beyond simple price movement. We track how implied volatility is shifting across different strikes and time frames. When institutional flow starts building in specific areas, our systems detect those patterns and surface them for your attention.
The Greeks get the same treatment. Instead of raw Delta and Gamma numbers, you see how current levels compare to historical norms and what that means for different market scenarios. Our risk assessment frameworks model potential outcomes before you commit capital.
Building Confidence Through Clarity
Our goal isn't to make decisions for you — it's to give you the context needed to make confident decisions yourself.
When you see our analysis highlighting a specific strike, you understand not just what the opportunity is, but why it exists and what risks you're accepting.
Our quality metrics ensure you're not trading thin markets that could hurt you on entry or exit.
Most importantly, our time-sensitive alerts will help you avoid the analysis paralysis trap. When market conditions align with profitable opportunities, you get clear signals rather than mountains of data to interpret.
Intrigued?
Welcome to Halcyon Waters! Your Calmness Among Crypto Chaos.
Frequently Asked Questions
Why do crypto options dashboards overwhelm smart traders?
Dashboards show raw data without context. Unlike educational videos with clean examples, real trading interfaces present hundreds of strikes, varying implied volatilities, and complex Greeks without guidance on which numbers matter for actual trading decisions.
What makes crypto options analysis different from traditional options?
Crypto options regularly trade with implied volatilities above 100%, compared to 30% in traditional markets. Volume patterns are unpredictable, and the lack of historical precedent makes standard analysis frameworks less reliable.
How do you avoid analysis paralysis in options trading?
Use analytical frameworks that provide historical context, quality scoring for liquidity, and automated filtering of untradeable strikes. Focus on clear decision-making criteria rather than trying to analyze every available option.
What should beginners look for in a crypto options dashboard?
Quality indicators for liquidity, implied volatility percentile rankings compared to historical data, automated filtering of thin markets, and clear risk assessment for potential trades rather than raw Greeks and pricing data.
Why do Deribit options seem confusing to new traders?
The interface prioritizes data completeness over decision-making clarity. It shows every available strike and expiration without context about which ones are actually tradeable or align with specific market outlooks.