Reading the Storm: How BTC Options Volume Heatmaps Predicted the $115K Breakout
A real-time case study showing how options volume heatmap analysis correctly predicted Bitcoin's explosive move from $114K to $115K, and why the subsequent put activity reveals sophisticated institutional positioning rather than bearish sentiment.
"The market's loudest signals often come from its quietest moments."
Sometimes the most powerful trading insights emerge not from dramatic price moves or headline-grabbing events but from subtle shifts in market behavior that reveal the psychology of professional traders. In this article we share the story of how Bitcoin options volume analysis correctly predicted a significant breakout, demonstrating why understanding market microstructure matters more than following price action alone.
On Tuesday, 2025/09/09, as Bitcoin hovered around $114,000, our Cayø Largo volume heatmap analysis revealed something fascinating: options activity had dramatically diminished over the previous three hours compared to the intense trading observed earlier. This wasn't random market noise — it was a classic pre-breakout pattern that sophisticated traders recognize but most market participants miss entirely.
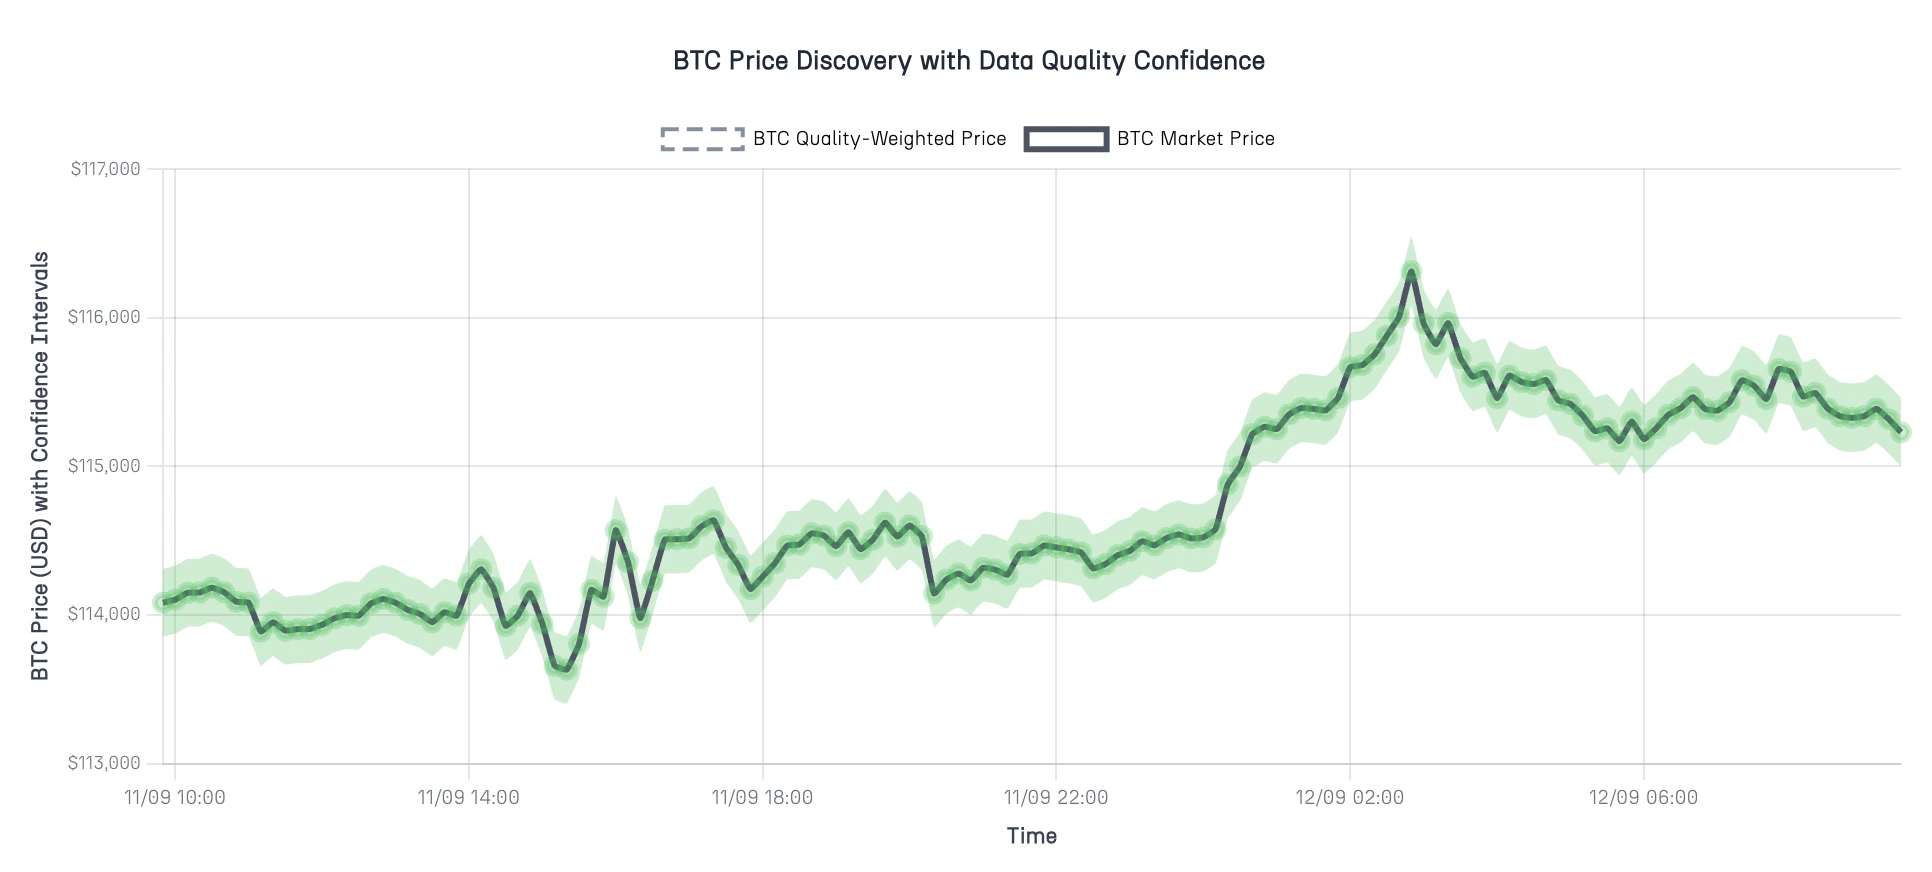
Figure 1: Bitcoin breaking sideway trading near $114-115K resistance levels (2025/09/11-12)
Within 24 hours, Bitcoin exploded through $115,000, validating the volume-based prediction and creating a perfect case study for understanding how options flow analysis provides early signals for major price moves. But the story doesn't end with the breakout. The subsequent surge in puts activity reveals, in our opition, a focused institutional positioning that challenges conventional wisdom about bearish sentiment.
The Prediction: Spotting the Calm Before the Storm
Market timing often comes down to recognizing patterns that repeat across different assets and time frames. When our volume heatmap analysis showed Bitcoin options activity grinding to a halt while spot price approached the psychologically significant $114,000 level, all the elements of a classic pre-breakout setup were falling into place.
The pattern was unmistakable: heavy volume clusters from 3-6 hours earlier had given way to an eerie quiet across strike distributions. This wasn't the gradual tapering you might expect during normal consolidation. It was the abrupt cessation of activity that typically precedes major directional commitments.
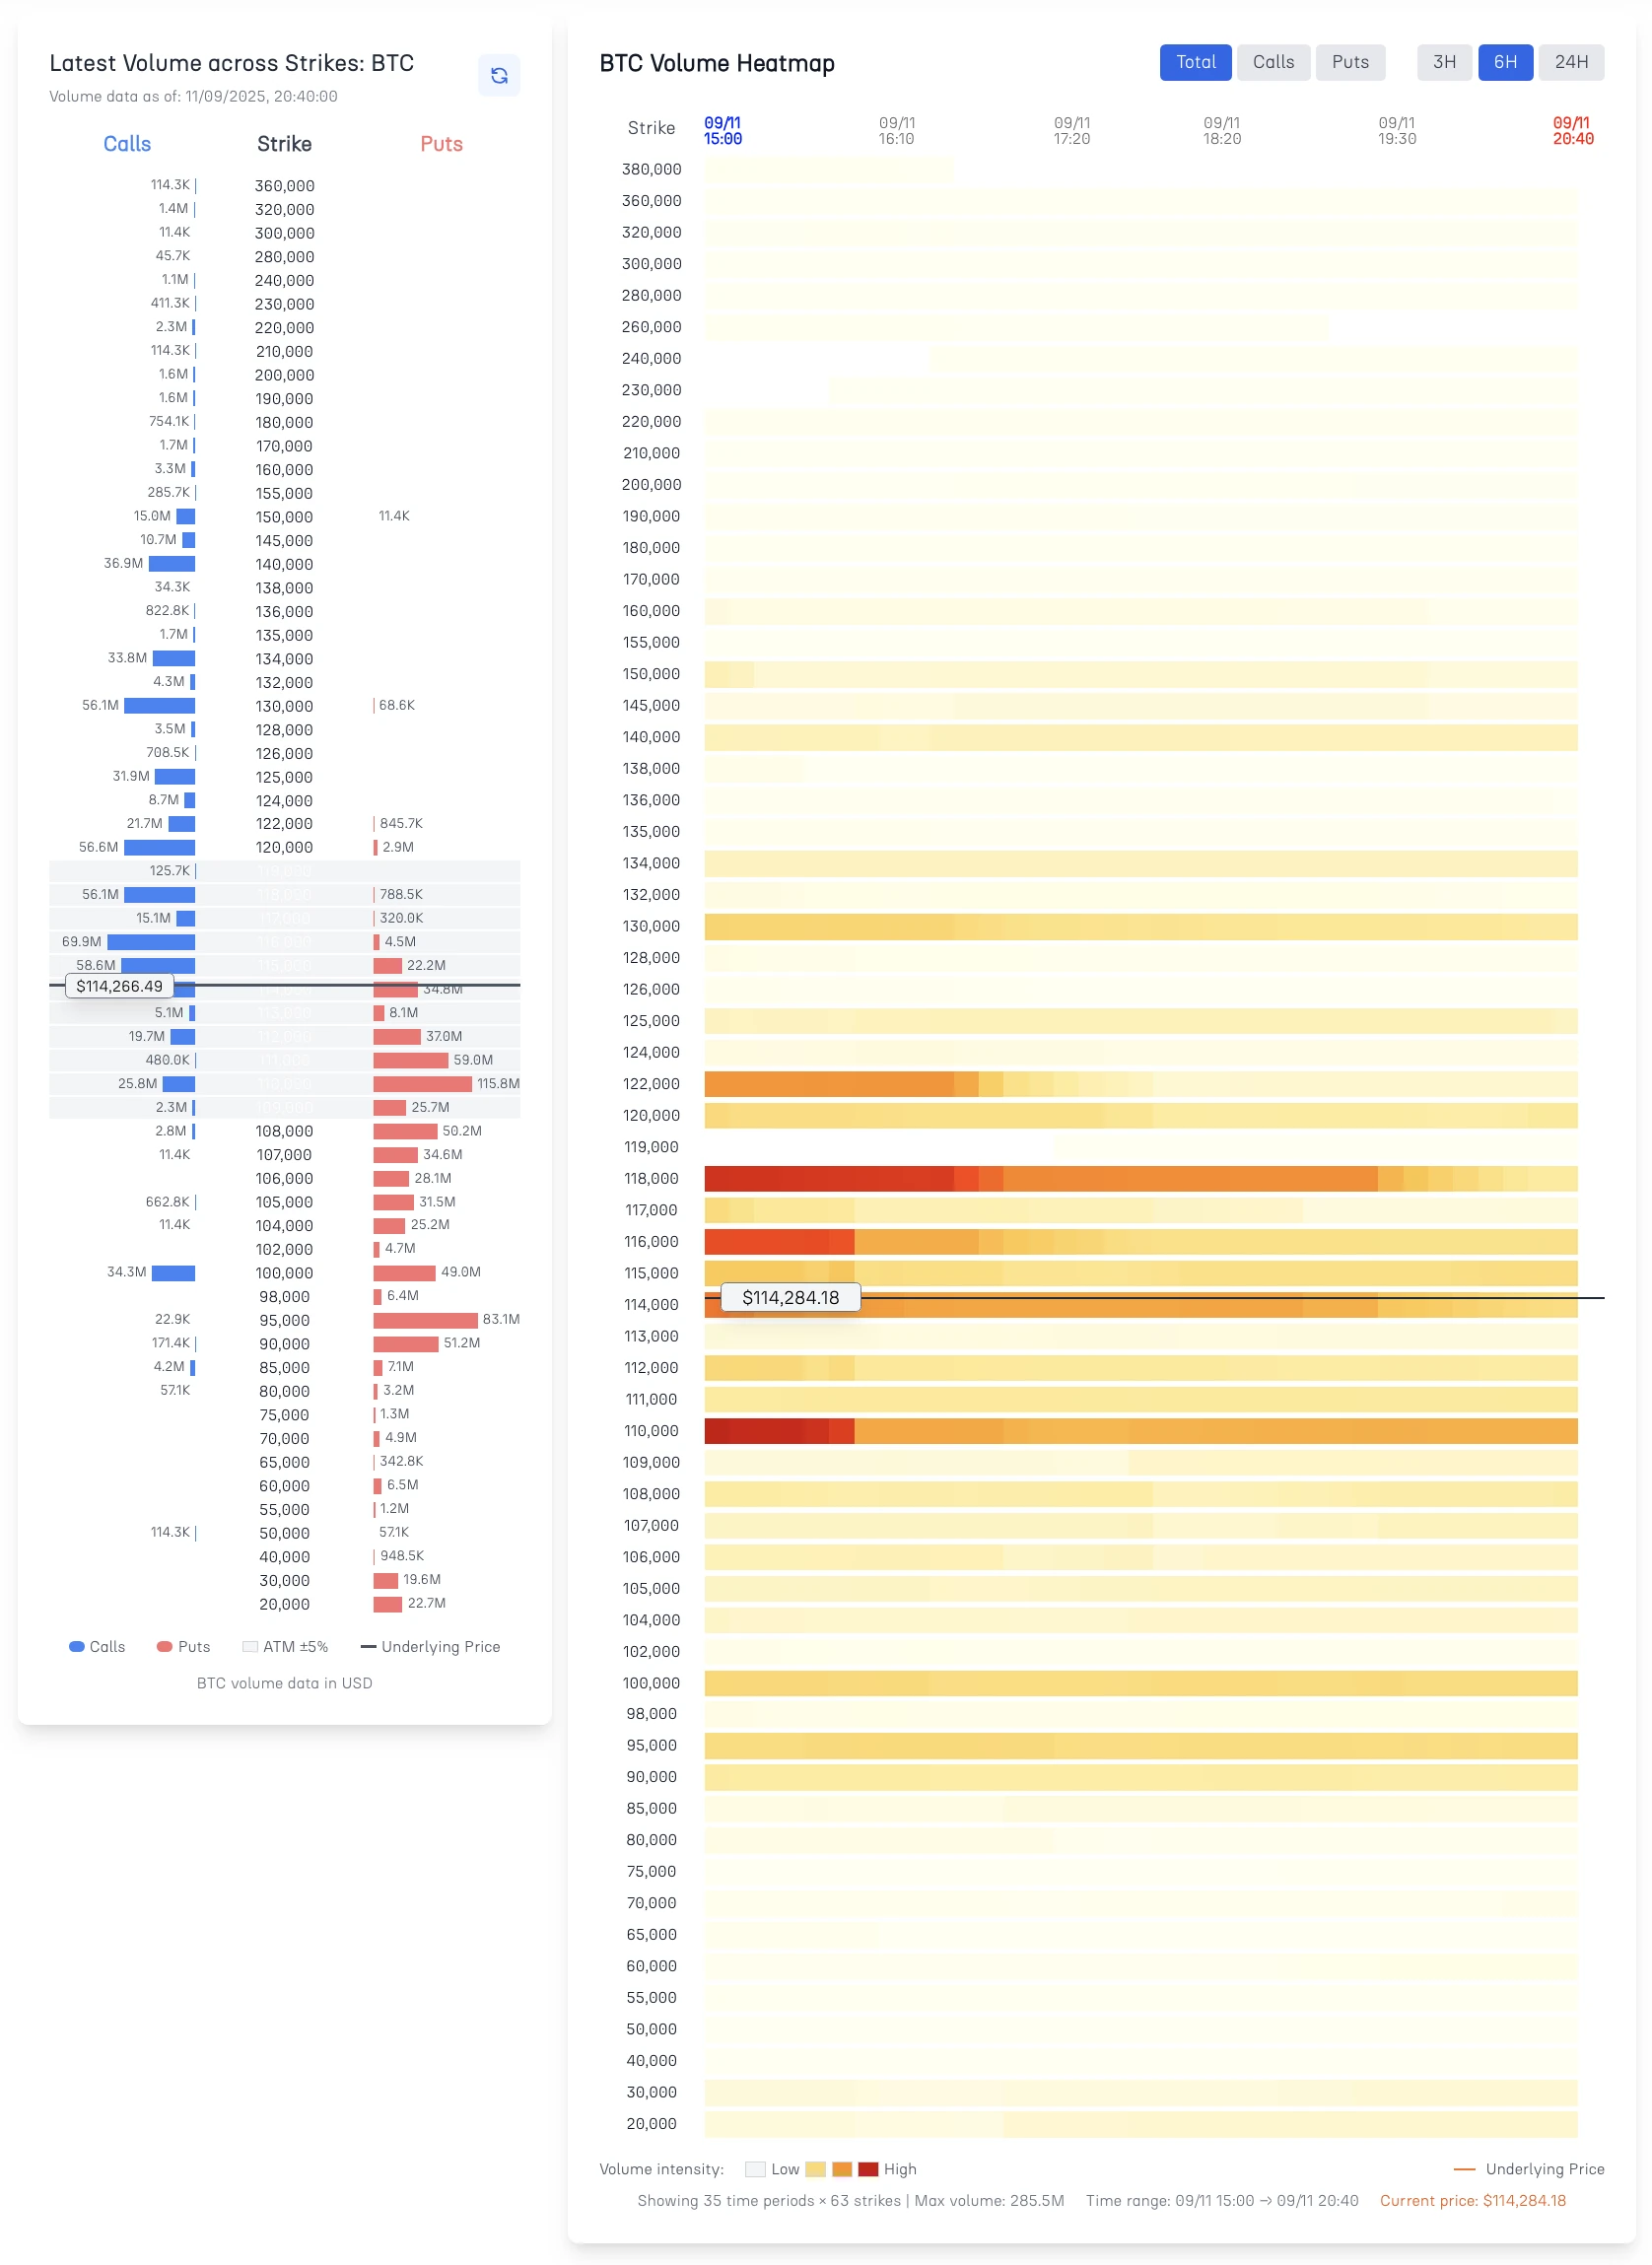
Figure 2: Pre-Breakout Analysis - Dramatic volume reduction near $114K resistance
Understanding this pattern requires recognizing what drives options activity around major price levels. When spot price approaches significant psychological barriers like, in this case study, $114,000, traders face a decision point: commit to directional positioning or wait for market resolution. The volume quiet-down signals that the majority have chosen to wait.
This waiting period creates opportunity for those who understand the underlying psychology. Options traders step back not because they lack conviction, but because they recognize the elevated risk of whipsaws and false breakouts around major levels. They prefer to let the market declare its intentions before re-entering with size.
The key insight from our analysis was recognizing that this pause represented preparation rather than indecision. The previous heavy volume indicated significant interest in Bitcoin options positioning. The subsequent quiet suggested that interest remained but was temporarily sidelined pending directional clarity.
Understanding Pre-Breakout Volume Psychology
Volume patterns around major price levels reveal something fascinating about market psychology that pure price charts can't show. When Bitcoin approached $114,000, the options market essentially held its breath—and this silence carried important clues about what would happen next.
Major psychological levels like $100,000, $110,000, $120,000, etc., create natural decision points for traders. Below this level, Bitcoin had established support and resistance zones that everyone understood. Above it, new price discovery would begin, potentially triggering algorithmic buying and institutional repositioning.
The volume reduction we observed wasn't random. In our view, it represented calculated waiting. Breakout attempts from major levels often produce violent price swings in either direction. Rather than guess which way, smart money waits for the market to show its hand first.
The Three-Phase Pattern Recognition:
👉 1. Accumulation Phase (3-6 hours prior): Heavy options volume as traders position for anticipated breakout attempt
👉 2. Pause Phase (1-3 hours prior): Dramatic volume reduction as traders await directional commitment
👉 3. Breakout Phase (0-1 hours): Volume explosion as market commits to direction and traders re-engage
This pattern repeats because it reflects basic human psychology around uncertainty and risk-taking. When facing unclear outcomes, most traders prefer to wait for confirmation rather than gamble on direction.
The timing matters too. Pause phases typically last 2-4 hours maximum. When volume stays quiet longer than that, it usually signals failed breakout attempts or sideways consolidation rather than explosive moves. Our Tuesday analysis hit the sweet spot timing window perfectly.
The Breakout: When Silence Turns to Action
Bitcoin's explosive move through $115,000 provided textbook confirmation of volume-based breakout analysis. The progression from volume quiet to price action to renewed activity demonstrated why understanding market microstructure provides superior timing signals compared to pure technical analysis approaches.
The breakout itself exhibited characteristics that validated our pre-movement analysis. Instead of grinding slowly through resistance with multiple false starts, Bitcoin powered through $114,000 with conviction, reaching $115,590 before establishing a new trading range. This decisive action reflected the pent-up positioning energy that had been building during the volume pause.
Equally important was the speed of volume re-engagement. Within hours of the breakout, options activity returned to elevated levels as traders who had been waiting on the sidelines moved to establish new positions or adjust existing exposure. This rapid re-engagement confirmed that the volume quiet represented temporary positioning rather than lack of interest.
Post-Breakout Volume Characteristics:
- Immediate Re-engagement: Options volume returned to high levels within 2 hours
- Strike Distribution Shifts: Activity moved toward higher strikes reflecting new price reality
- Institutional Flow Increases: Large block trades indicated professional repositioning
- Volatility Surface Adjustments: IV levels adjusted to reflect new trading range dynamics
The timing accuracy of the prediction i.e. calling the pause before the storm just hours before the actual breakout demonstrates the practical value of volume-based analysis for trading decision-making. Traders who recognized the pattern could position ahead of the move rather than chasing price action after the fact.
Post-Breakout Put Activity: Smart Money Hedging
The real value in our analysis emerged after Bitcoin's successful breakout, when the 24-hour volume heatmap began lighting up with puts activity across multiple strikes. This development challenges the common misconception that buying put options represents bearish sentiment.
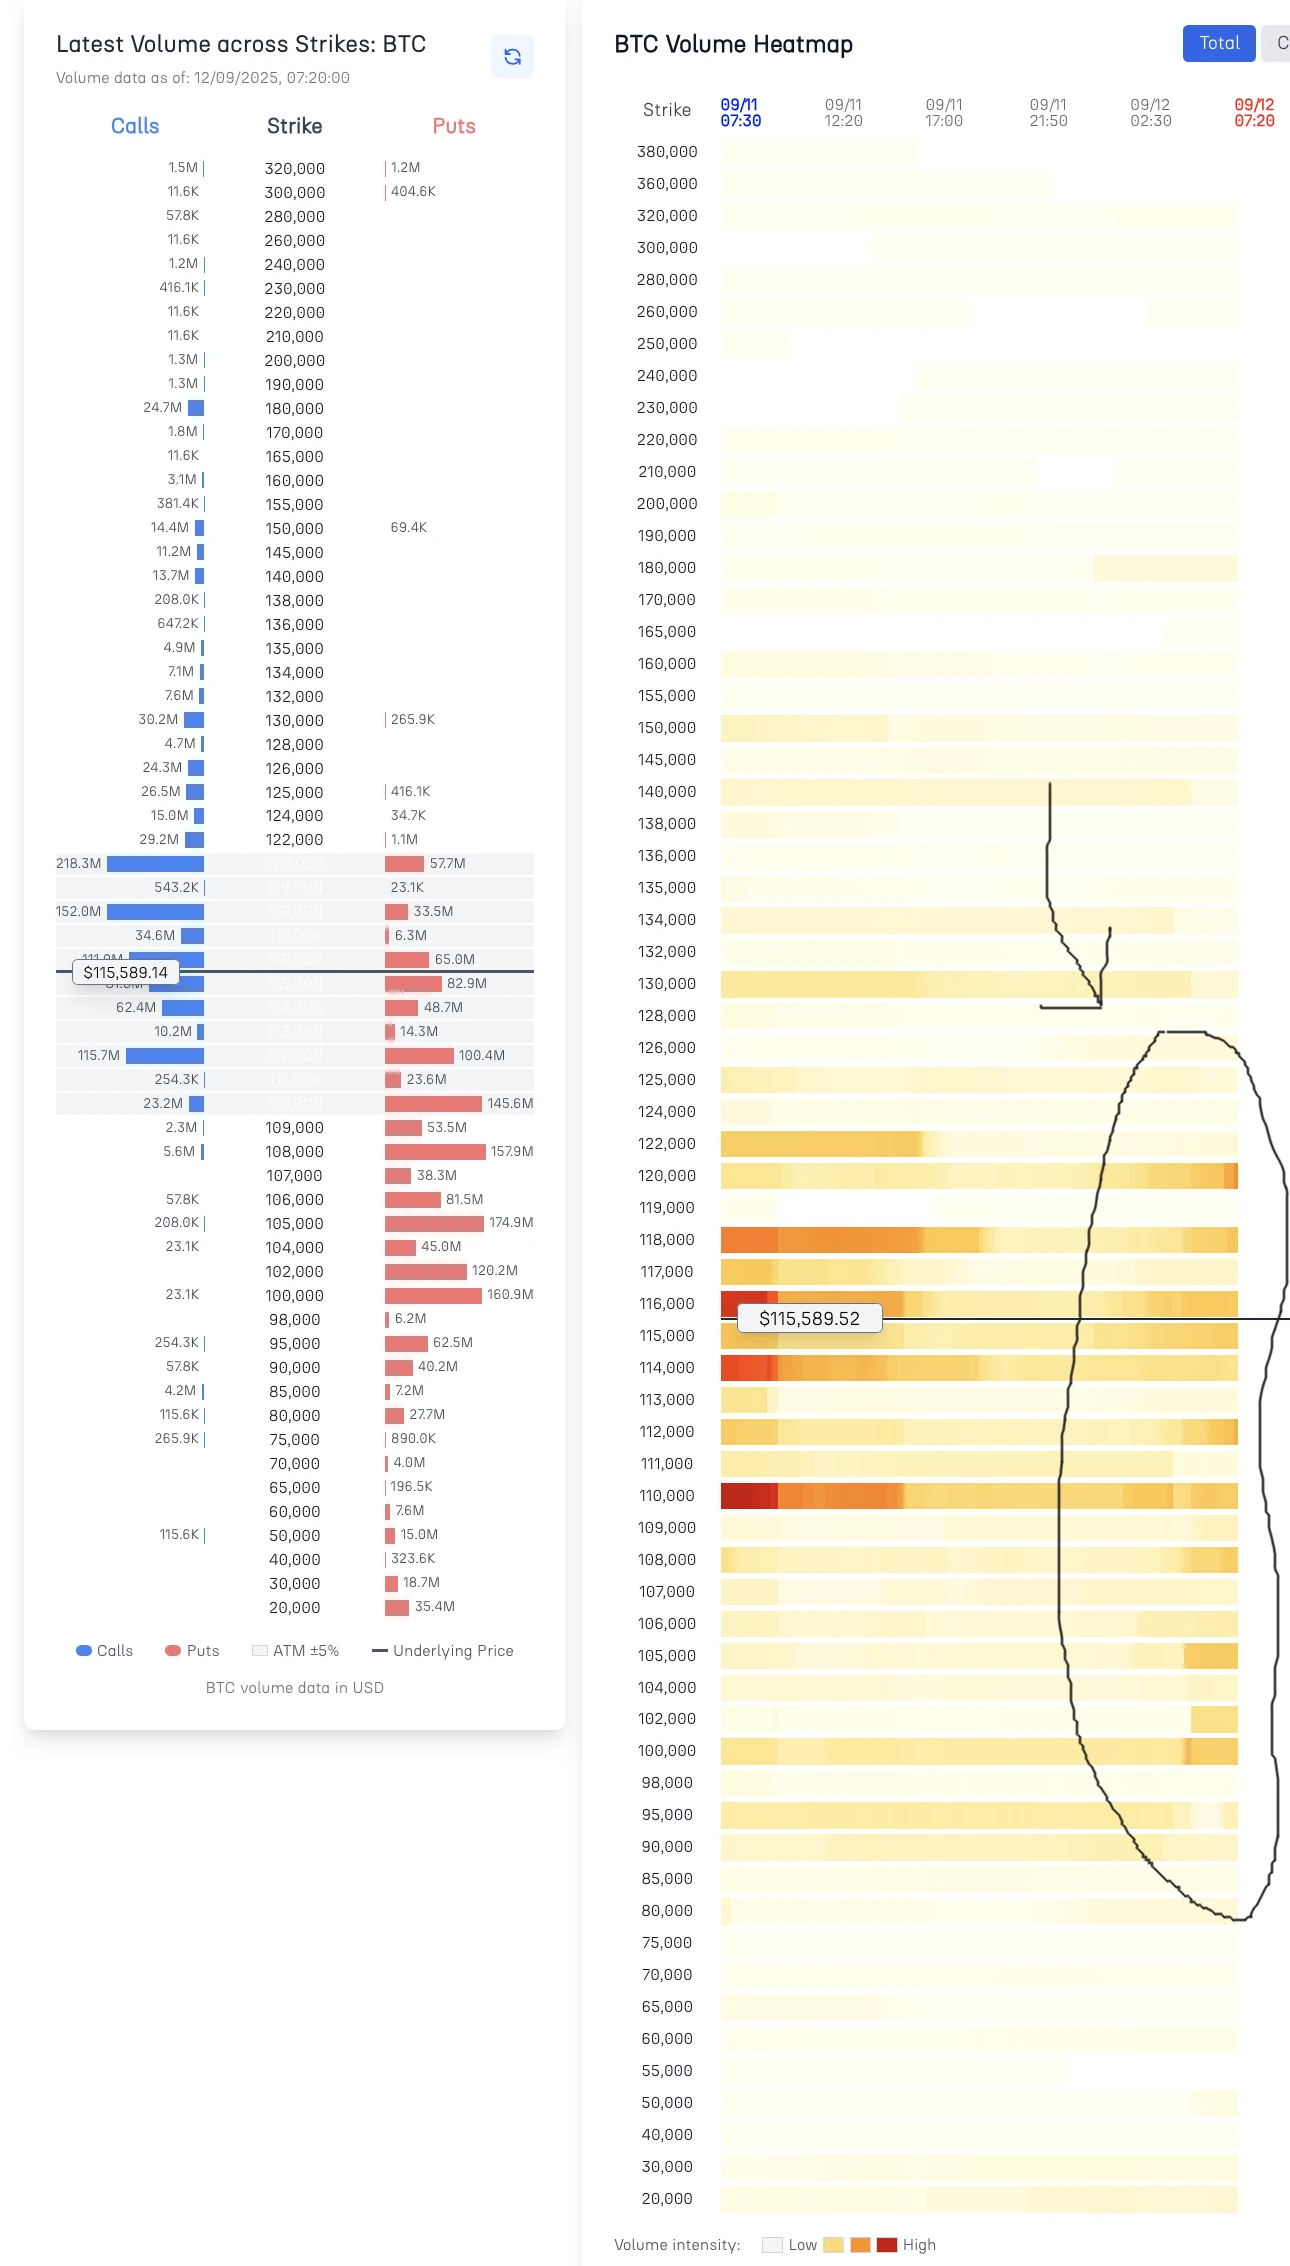
Figure 3: Post-Breakout Analysis - Puts activity indicates sophisticated hedging strategies
Understanding why puts become active after successful breakouts requires appreciating the risk management psychology of professional traders. These institutions don't buy puts because they expect Bitcoin to crash—they buy puts because they want protection against volatility while maintaining upside exposure.
The specific pattern we observed i.e. puts clustering around the $110,000 $113,000 strikes reveals strategic thinking about support level placement. Rather than placing protective puts far out of the money, traders position them at levels that provide meaningful downside protection while avoiding premium waste on unlikely scenarios. Let's summarize it as follows:
Strategic Put Positioning Logic:
- Momentum Protection: Use breakout momentum to establish hedges at favorable prices
- Support Level Targeting: Position puts near technical support zones for maximum effectiveness
- Premium Efficiency: Buy protection during elevated volatility rather than chasing insurance during selloffs
- Portfolio Rebalancing: Adjust overall exposure while maintaining core positioning
This hedging behavior actually represents bullish positioning disguised as put activity. These traders believe in Bitcoin's upward trajectory sufficiently to maintain large long exposure while purchasing strategic downside protection. This combination allows for participation in continued upside while managing tail risk.
Technical Analysis: Reading Volume Distribution Patterns
The Cayo Largo volume heatmap system reveals market structure dynamics that traditional charting approaches cannot capture. By analyzing transaction distribution across strikes and time periods, we can identify patterns that provide early warning signals for major price movements and institutional repositioning.
Volume distribution analysis operates on several key principles that distinguish it from simple volume indicators. Instead of looking at aggregate trading activity, we examine how that activity spreads across the options complex, revealing the strategic thinking behind professional positioning decisions.
Critical Pattern Recognition Elements:
Strike Clustering Analysis: When volume concentrates heavily at specific strikes, it indicates professional conviction about price targets or support/resistance levels. The pre-breakout period showed minimal clustering, suggesting uncertainty about directional outcomes.
Temporal Distribution Patterns: The 3-hour volume reduction we identified represents a specific timing signature that precedes major directional moves. This pattern occurs because professional traders require confirmation signals before committing significant capital.
Put/Call Ratio Dynamics: The post-breakout shift toward put activity, while maintaining overall volume levels, reveals sophisticated hedging rather than sentiment reversal. This nuanced interpretation requires understanding institutional risk management practices.
Quality-Weighted Volume Assessment: Not all volume carries equal information value. Our system weights transactions based on size, execution characteristics, and institutional indicators to filter signal from noise.
The mathematical foundation underlying these patterns reflects deeper market structure principles. Most importantly, the system provides real-time analysis rather than historical pattern identification. This timing advantage allows for tactical positioning ahead of major moves rather than reactive trading after price action confirms trends.
Experience volume intelligence that predicts rather than reacts
Access live volume heatmap analysis for BTC, ETH, SOL, and XRP options at cayolargo.fi/vol-distr — featuring real-time institutional flow tracking and breakout pattern recognition.
The Cayø Largo intelligence engine transforms options trading by revealing market structure patterns invisible to traditional analysis, enabling traders to position ahead of major moves rather than chasing price action after the fact.
Frequently Asked Questions
How did volume heatmap analysis predict Bitcoin's breakout?
The heatmap reveals dramatically diminishing options activity over 3 hours while BTC approach resistance levels. This volume quiet-down is classic pre-breakout behavior where traders pause positioning before major price commitments.
Why put activity increases after Bitcoin's breakout?
Increased put volume after breakouts typically represents institutional hedging rather than bearish sentiment. Sophisticated traders use momentum to establish protective positions, protecting gains rather than betting against the rally.
What makes crypto options volume analysis different from traditional markets?
Crypto options markets have unique 24/7 trading patterns, extreme volatility cycles, and different liquidity profiles that create distinct volume signatures not seen in traditional equity options.
How reliable are volume-based breakout predictions?
Volume pattern analysis becomes more reliable when combined with psychological price levels. The combination of diminishing activity near key resistance plus subsequent volume expansion creates higher probability signals.