Why Every Options Trader Needs Two IV Curves and Most Only See One?!
Traditional IV curves show elegant mathematical beauty but hide execution reality. Our Enhanced IV Term Structure Intelligence reveals what happens when you trade those curves – introducing dual-line analysis that separates market fiction from volume-weighted reality, transforming options education and professional trading alike.
"A single IV curve is a dangerous oversimplification – the market demands you see both what exists and what you can actually trade."
Options traders spend years learning to read implied volatility term structures, studying the elegant curves that reveal market expectations of future price movement. These mathematical sculptures represent collective wisdom about uncertainty, risk premiums, and time decay – yet they harbor a fundamental deception that quietly undermines trading performance.
Every IV curve you see represents a compromise between mathematical elegance and market reality. The smooth 37% volatility reading at 30 days might reflect genuine market consensus backed by institutional flow, or it could represent thin algorithmic quotes that vanish the moment you try to trade them. Traditional analytics treat both scenarios identically, creating systematic blind spots in strategy development and risk assessment.
This analytical gap explains why seemingly straightforward volatility strategies often produce unexpected results. A trader implementing calendar spreads based on term structure analysis may find execution occurring at levels far from displayed curves, not due to market movement but due to reliance on screen fiction rather than tradeable reality. The solution requires abandoning single-curve thinking in favor of dual-line intelligence that separates market expectations from execution truth.
The IV Curve Deception Problem
Traditional implied volatility analysis operates under the assumption that displayed curves represent tradeable consensus. This assumption worked reasonably well in equity markets with deep institutional liquidity and tight regulatory oversight. However, cryptocurrency options markets present unique challenges that expose the limitations of single-curve thinking.
Consider the mathematical beauty of a traditional IV term structure: a smooth curve rising from short-term realized volatility toward longer-term uncertainty. This elegance masks the underlying complexity of market microstructure, where different expiration points may have vastly different liquidity profiles, data quality, and execution characteristics.
The problem becomes acute during strategy analysis. A trader evaluating volatility skew between different expirations needs to know whether observed differences reflect genuine market sentiment or simply varying degrees of quote reliability. Traditional analysis provides no framework for distinguishing between these scenarios, leading to systematic misjudgments about market conditions and strategy viability.
The mathematical leverage inherent in options strategies amplifies these analytical shortcomings. Small errors in volatility assessment compound through gamma exposure and vega sensitivity, creating portfolio drift that accumulates over time regardless of directional accuracy. Professional traders require analytical frameworks that acknowledge execution reality rather than assuming theoretical perfection.
This reality check becomes essential in cryptocurrency markets, where 24/7 trading, extreme volatility, and varying regulatory environments create market conditions that traditional equity-based analytics cannot adequately address. The solution demands analytical evolution that preserves mathematical rigor while acknowledging practical trading constraints.
Learning Mode: Building Intuition
The Enhanced IV Term Structure Intelligence addresses these challenges through a progressive educational framework that builds from intuitive understanding toward sophisticated market analysis. Learning mode introduces the dual-curve concept without overwhelming users with institutional-grade complexity.
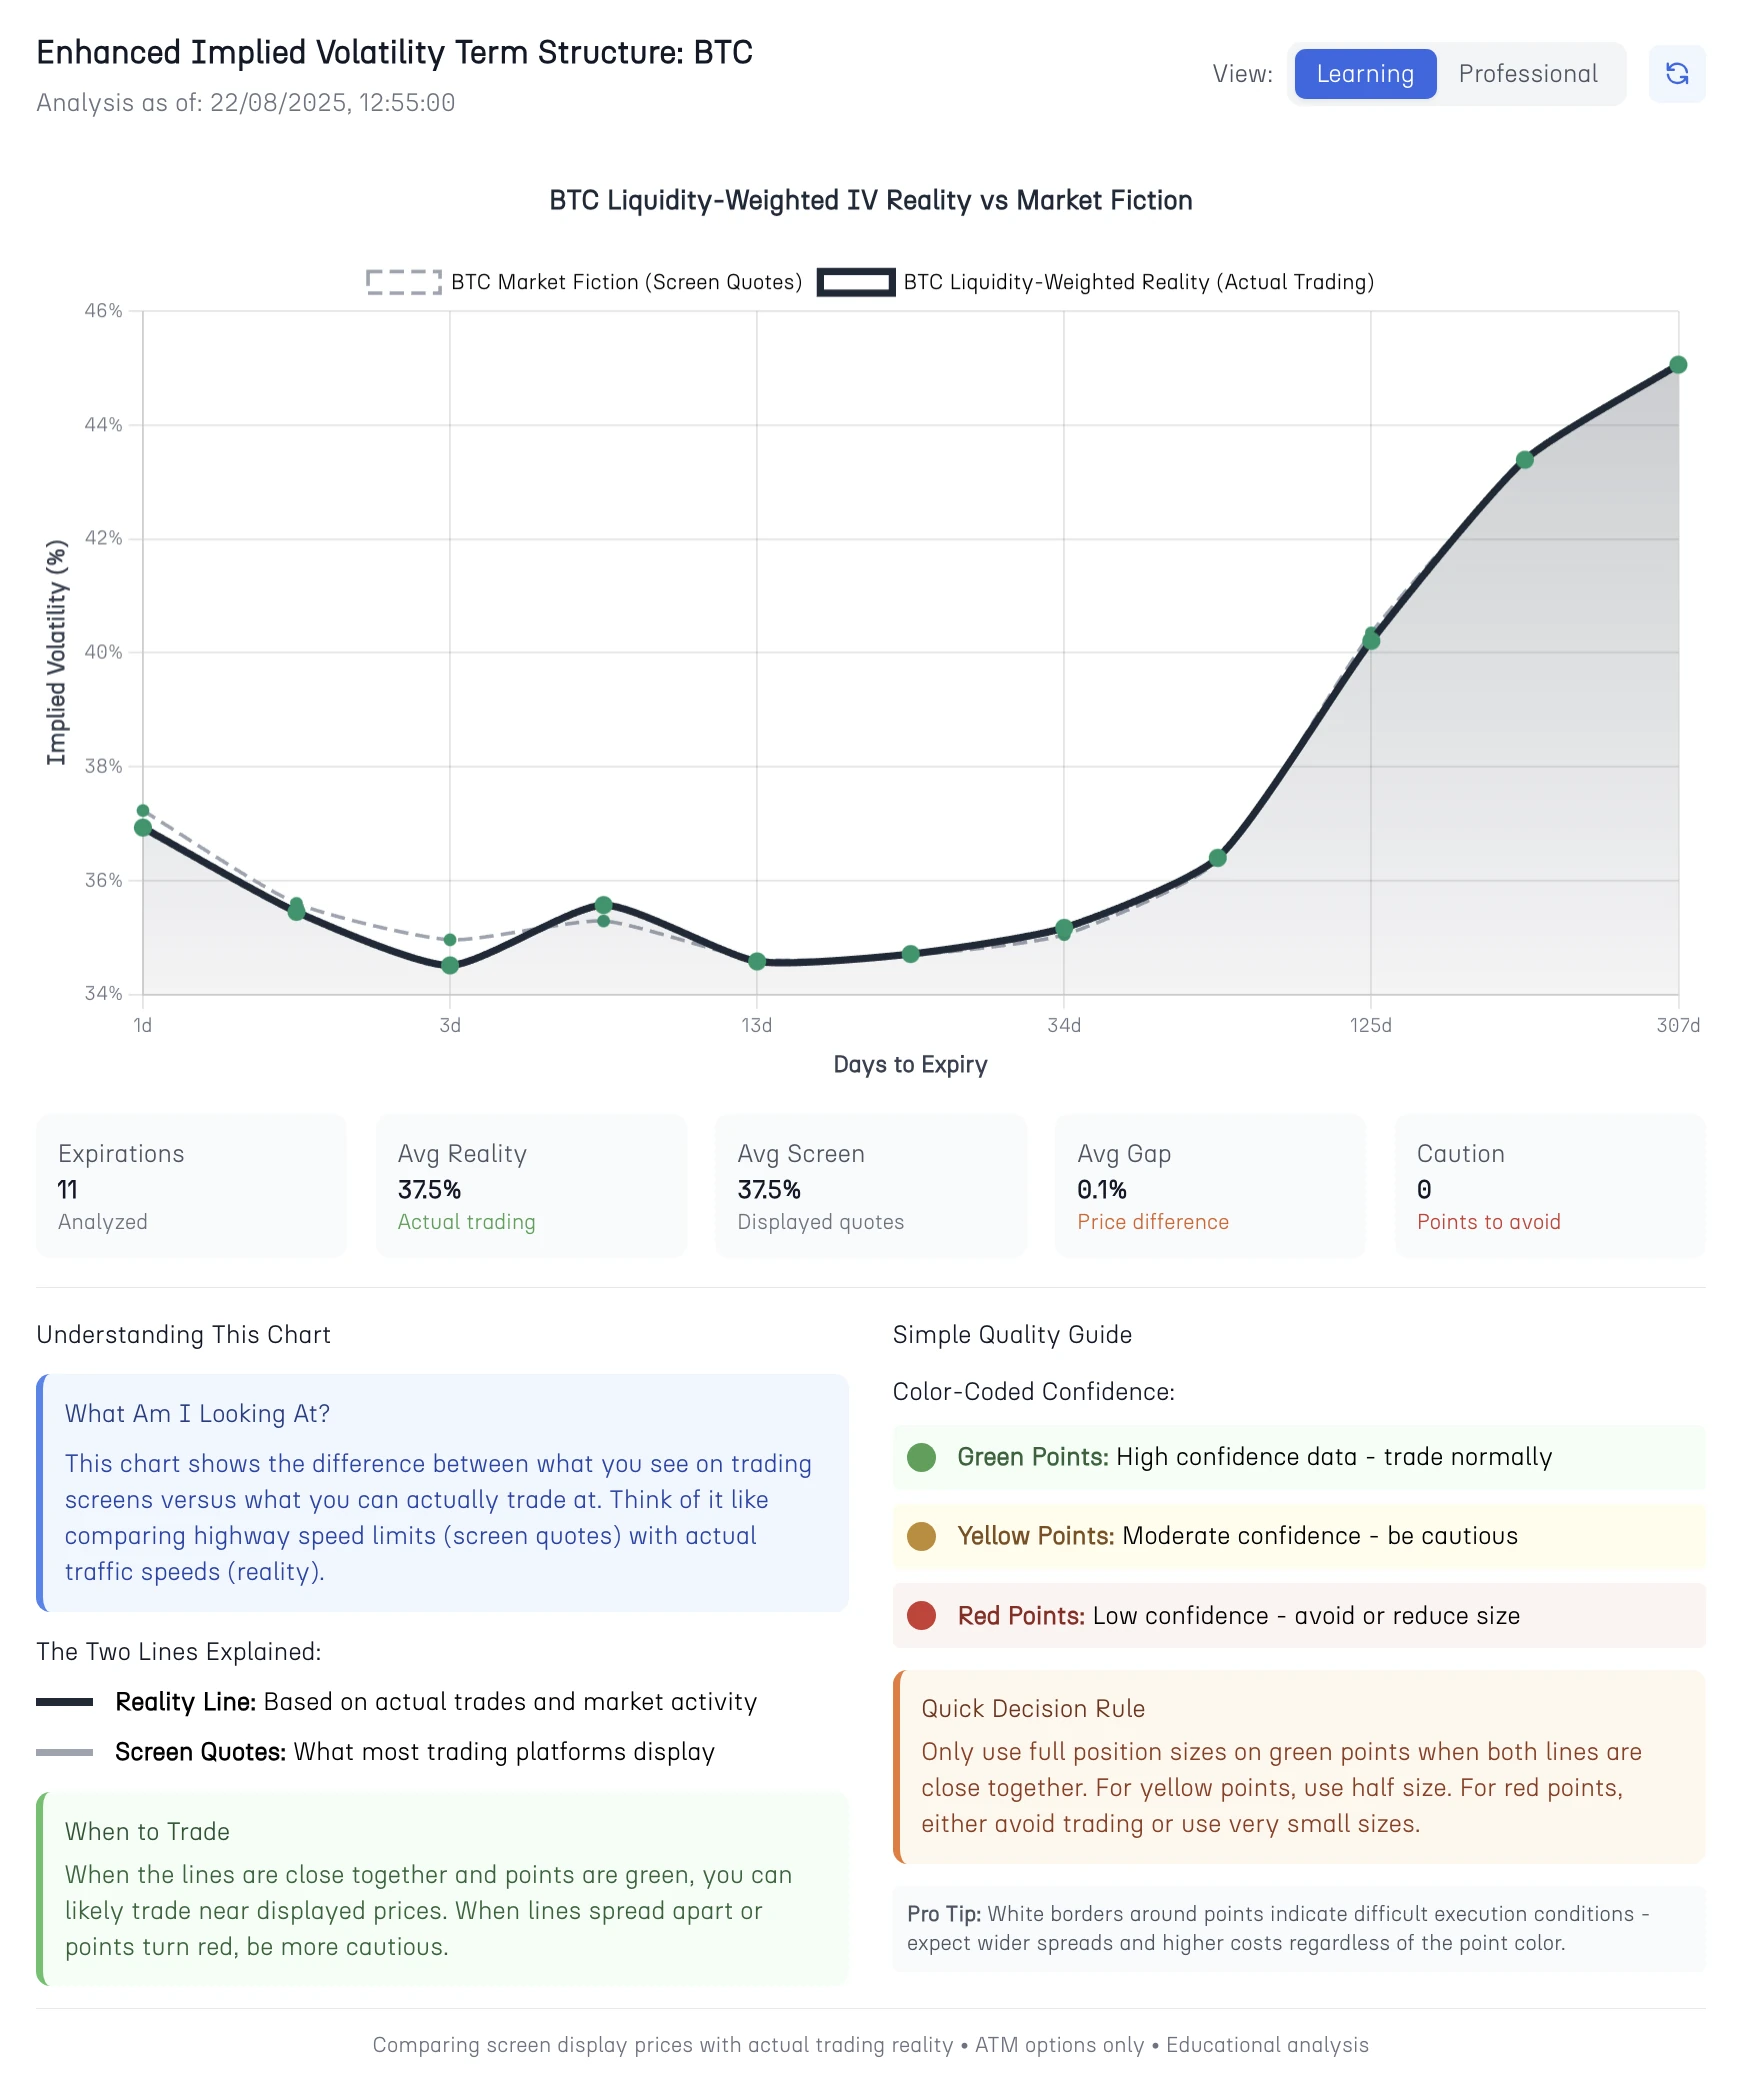
Figure 1: Learning Mode - Educational Foundation for Understanding Reality vs Fiction in IV Analysis
Learning mode transforms complex volatility intelligence into accessible trading guidance through several key educational principles:
Visual Clarity: The dual-line approach immediately reveals the relationship between screen quotes (Fiction - dashed gray line) and execution reality (Reality - solid black line). When lines converge, execution quality is high. When they diverge, traders should expect execution challenges.
Quality-Based Coloring: Green points indicate institutional-grade data suitable for confident strategy execution. Yellow points suggest moderate confidence requiring position size adjustment. Red points warn of execution risk that may make strategy implementation inadvisable.
Simplified Insights: The system automatically generates educational commentary that explains market conditions in practical terms. Instead of requiring users to interpret statistical measures, the analysis provides direct guidance like "Good Trading Conditions: Screen prices closely match actual trading costs" or "High Risk Conditions: Expect to pay significantly more than displayed quotes."
Progressive Complexity: Learning mode introduces sophisticated concepts gradually. Users first understand the Reality vs Fiction distinction, then learn about quality assessment, and finally develop intuition about market regime recognition. This progression builds analytical confidence without overwhelming newcomers to volatility analysis.
The educational approach acknowledges that most traders need practical guidance rather than mathematical sophistication. Learning mode provides actionable intelligence while maintaining analytical rigor, creating a bridge between academic theory and trading practice.
Professional Mode: Advanced Intelligence
Professional mode exposes the full analytical sophistication of the Enhanced IV Term Structure Intelligence, providing institutional-grade market analysis for systematic strategy development and risk management.
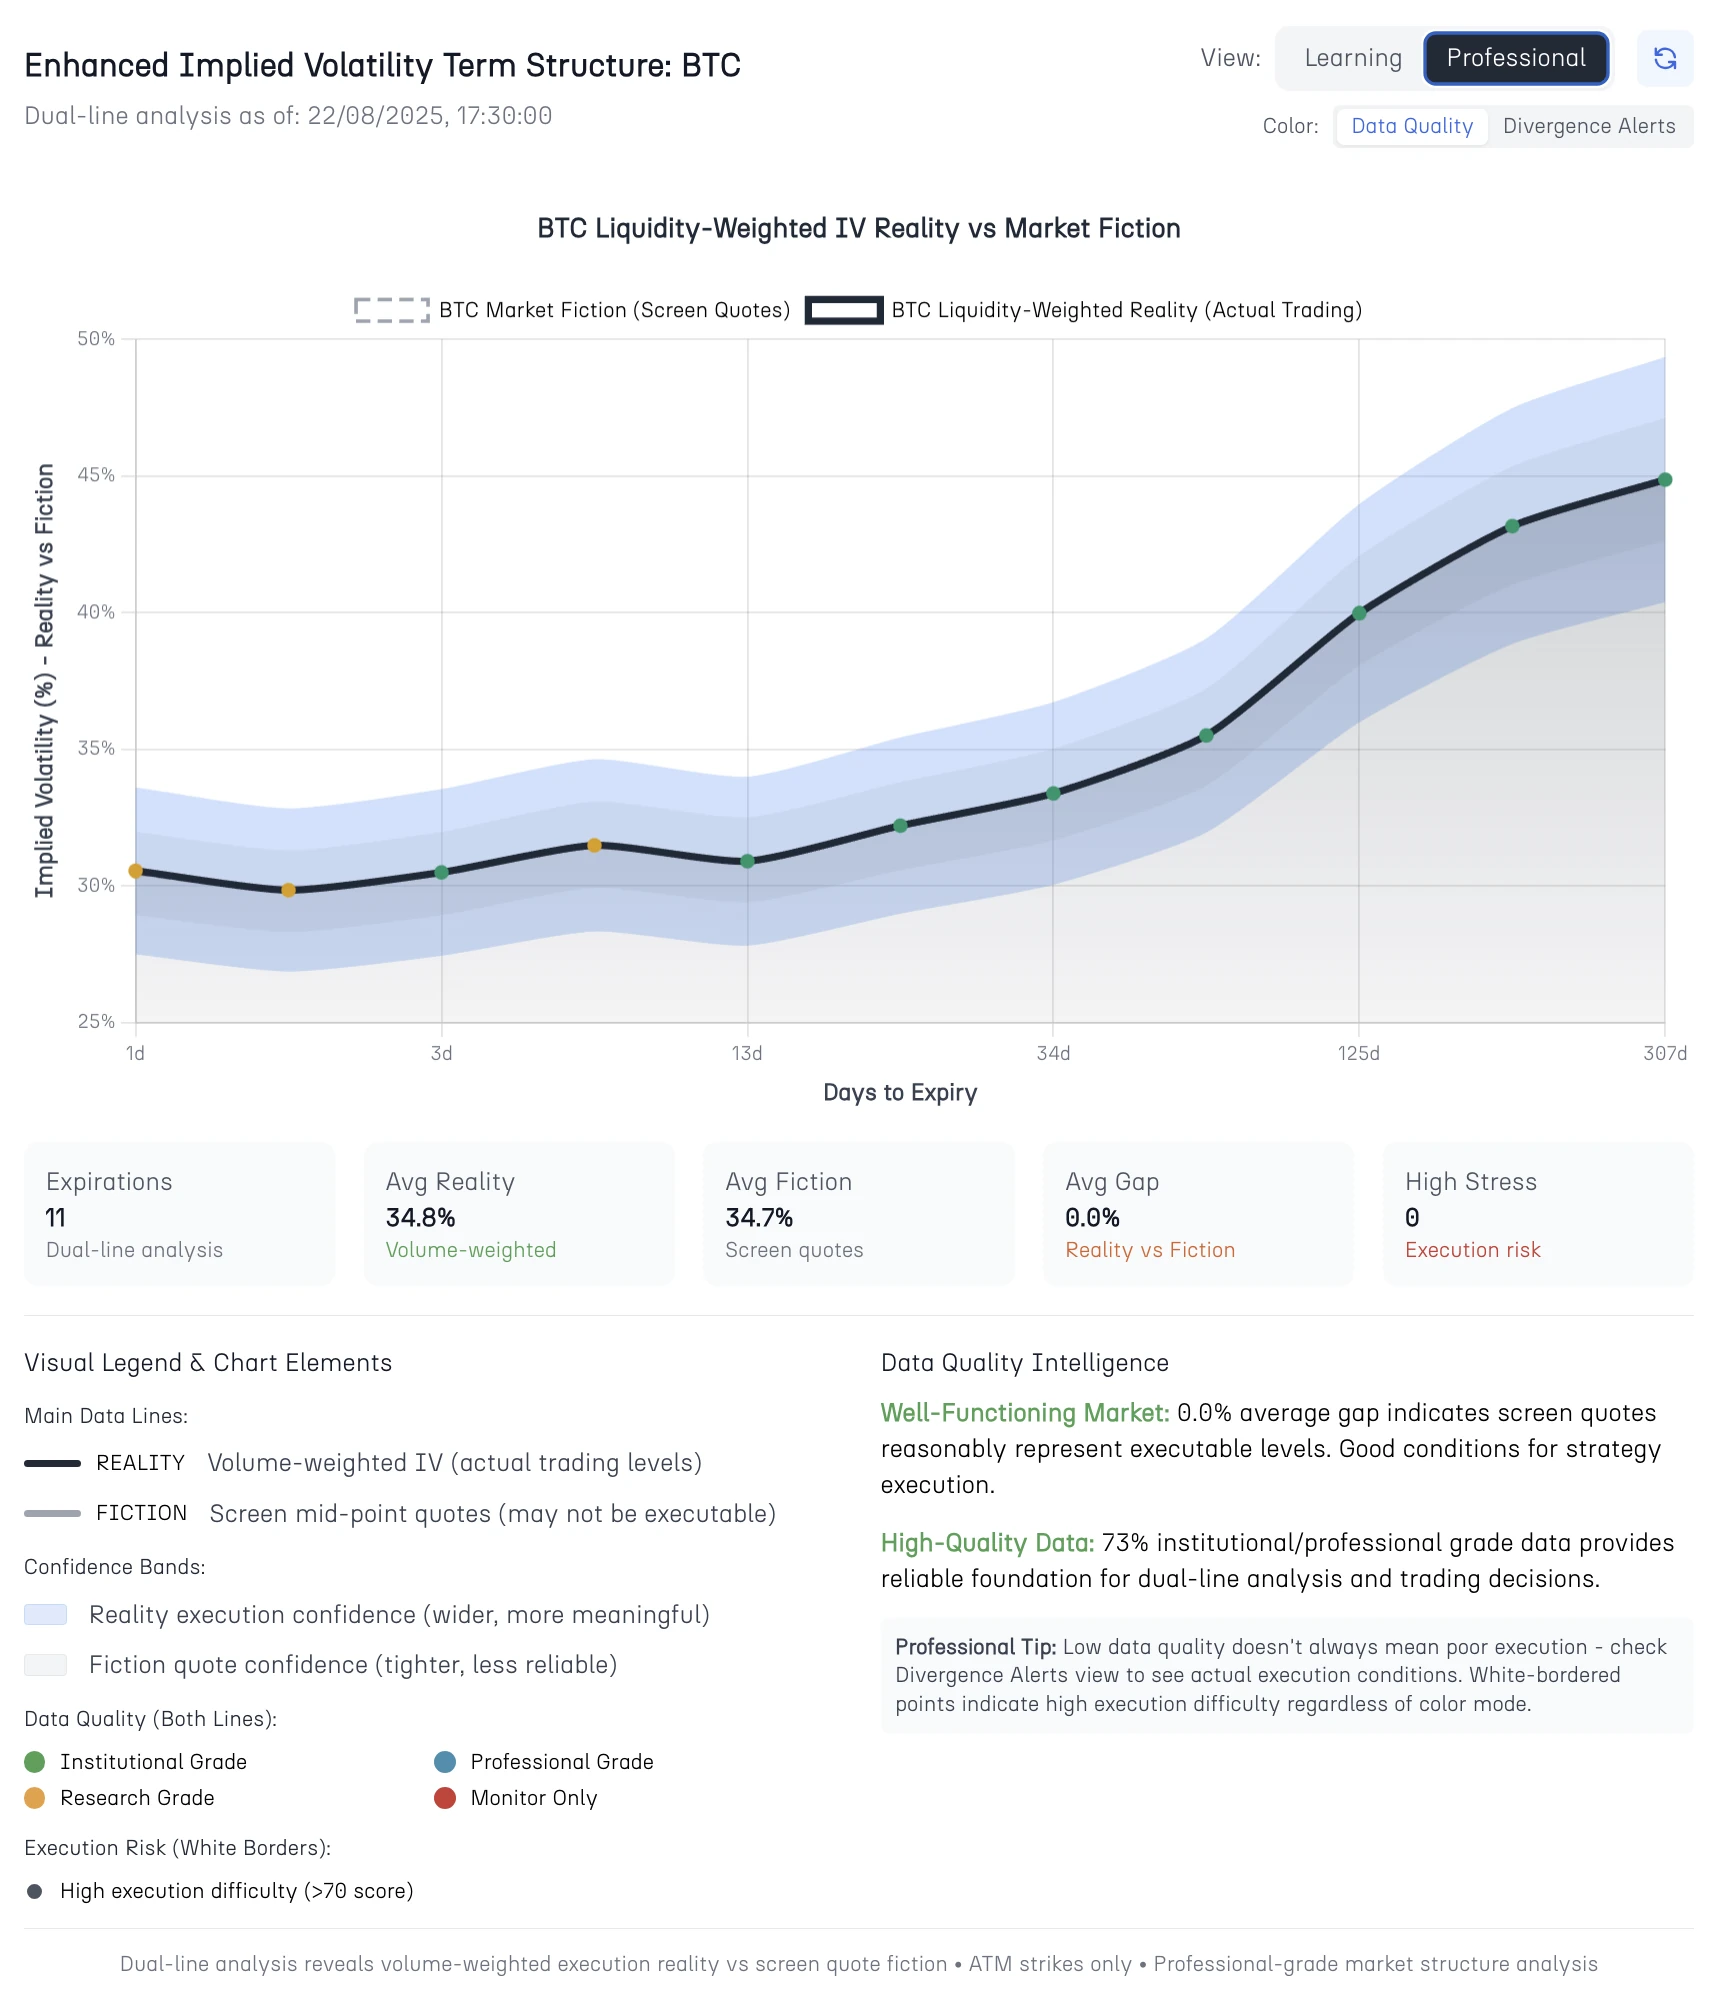
Figure 2: Professional Mode - Advanced Analysis with Confidence Intervals and Quality Assessment
Professional mode introduces several analytical layers that reveal market microstructure dynamics invisible in traditional IV analysis:
Dual Confidence Intervals: The system displays separate confidence bands for Reality (execution-based, shown in blue) and Fiction (quote-based, shown in gray). Reality confidence intervals typically appear wider, reflecting the additional uncertainty inherent in actual execution versus theoretical quotes. This visual distinction immediately reveals the difference between quote reliability and execution reliability.
Quality vs Divergence Toggle: Professional users can switch between two coloring schemes. Data Quality mode colors points based on institutional reliability scoring, while Divergence Alerts mode highlights points where Reality and Fiction curves show significant separation. This toggle allows traders to focus on either data reliability or execution risk depending on analytical priorities.
Advanced Tooltips: Professional mode provides comprehensive market intelligence including volume analytics, reliability scores, institutional flow analysis, and execution difficulty assessments. This detailed information supports systematic strategy development and automated trading system design.
Market Stress Indicators: The system continuously monitors for market stress conditions that affect volatility surface quality. High-stress periods receive special highlighting, warning professional traders about periods when normal analytical frameworks may produce unreliable results.
The professional interface assumes users understand market microstructure concepts and can interpret sophisticated analytical measures. This mode serves institutional traders, systematic strategy developers, and experienced practitioners who require complete analytical transparency for decision-making processes.
The Bandwidth Problem: Why Point Estimates Lie
Every volatility number on your screen carries a hidden story about market quality that traditional analytics refuse to tell. That crisp 37% implied volatility reading represents not mathematical certainty, but a central tendency surrounded by uncertainty that varies dramatically based on market conditions most traders never see.
The bandwidth around each volatility estimate reveals more about trading opportunity than the estimate itself. A tight 37% ± 0.3% reading signals institutional-grade market consensus where strategies execute as modeled. A wide 37% ± 4.8% reading warns that the displayed number represents wishful thinking rather than tradeable reality.
Traditional volatility analysis commits a fundamental error by treating all 37% readings as equivalent, regardless of the market structure supporting them. This approach assumes precision where none exists, creating systematic blind spots that compound through strategy leverage and risk assessment.
The Reliability Spectrum Approach
Our Enhanced IV system abandons point estimate thinking in favor of reliability spectrum analysis. Each volatility reading receives bandwidth assessment that immediately reveals data quality and execution expectations:
Laser-Focused Bandwidth (±0.2%): Institutional money backing the quotes with substantial volume. Execute strategies aggressively with confidence that models match reality.
Professional Bandwidth (±0.8%): Solid market depth with predictable execution. Standard position sizing appropriate with minor execution buffer expectations.
Research Bandwidth (±2.1%): Useful for trend analysis but problematic for precise strategy implementation. Reduce position sizes and expect execution variation.
Speculation Bandwidth (±5.0%+): Displayed numbers may bear little relationship to execution reality. Avoid complex strategies entirely.
The bandwidth classification operates independently from the volatility level itself. A 25% volatility reading with wide bandwidth presents more execution risk than a 60% reading with tight bandwidth. This distinction transforms strategy selection from volatility-level based decisions to quality-based decisions.
Reality vs Fiction Bandwidth Divergence
The system exposes a critical market truth: Reality and Fiction estimates carry different uncertainty profiles. Fiction bandwidths typically appear tighter because they reflect only quote consistency, while Reality bandwidths incorporate actual execution uncertainty including market impact and liquidity constraints.
When Reality bandwidth significantly exceeds Fiction bandwidth, the market signals execution challenges ahead. Smart traders use this divergence as an early warning system, adjusting position sizes or waiting for bandwidth convergence before implementing strategies.
This bandwidth-first approach represents analytical evolution from false precision toward probabilistic assessment that acknowledges market uncertainty rather than hiding behind mathematical elegance.
Market Quality Assessment Framework
Cayø Largo's Enhanced IV Term Structure Intelligence incorporates a comprehensive quality assessment framework that classifies market conditions into actionable trading intelligence. This classification system enables systematic position sizing and strategy selection based on objective market quality measures.
-
👉 Institutional Grade Conditions: Characterized by substantial trading volume, high data reliability scores, and tight Reality vs Fiction convergence. These conditions support aggressive positioning and complex multi-leg strategies with confidence that execution will match analytical expectations.
-
👉 Professional Grade Conditions: Moderate volume and reliability with acceptable Reality vs Fiction alignment. Suitable for standard strategy implementation with appropriate position sizing adjustments to account for slightly elevated execution uncertainty.
-
👉 Research Grade Conditions: Limited volume or reliability that makes the data useful for trend identification and market monitoring but unsuitable for large position implementation. These conditions favor smaller position sizes and simpler strategy structures.
-
👉 Monitor Only Conditions: Poor data quality or extreme Reality vs Fiction divergence that makes trading inadvisable. The system recommends avoiding new positions and potentially reducing existing exposure during these periods.
The classification system operates continuously, providing real-time updates as market conditions evolve. This dynamic assessment enables traders to adjust their approach based on current market quality rather than relying on static assumptions about execution conditions.
Quality Scoring Methodology: The framework incorporates multiple factors including trading volume, bid-ask spreads, data reliability scores, institutional participation indicators, and historical execution quality measures. This multi-dimensional approach provides more robust quality assessment than single-metric systems that may miss important aspects of market structure.
When Intelligence Meets Trading Reality
Here's where the dual-curve framework stops being an interesting academic exercise and starts changing how you actually trade. Most volatility analysis ends with pretty charts and theoretical insights, but the real test comes when you're putting actual money at risk based on what the data tells you.
Smart Strategy Selection Based on Market Truth
You know that feeling when you've identified a perfect iron condor setup - the probabilities look great, the risk-reward seems attractive, but something feels off about execution? The dual-curve system explains that intuition. When Reality and Fiction curves run close together with tight confidence bands, those complex multi-leg strategies work exactly as your models predict. But when the curves start separating or the bands widen significantly, that beautiful iron condor becomes an execution nightmare with fills scattered across a range that destroys your theoretical edge.
During poor-quality periods, your best move shifts toward simpler approaches. Instead of trying to finesse complex spreads through deteriorating market conditions, you're better off with straightforward directional plays or protective puts that don't depend on precise execution across multiple strikes. The market tells you when it's ready for sophistication and when it demands simplicity.
Position Sizing That Adapts to Reality
Traditional position sizing uses account percentage rules that treat all market conditions equally. The intelligence framework changes this by making position sizing responsive to actual market quality. When you see institutional-grade conditions with tight Reality vs Fiction alignment, you can be more aggressive relative to your normal position limits. Those are the moments when the market functions as your models assume.
But when quality drops to monitor-only levels, the system essentially tells you to step aside entirely. Not reduce position size slightly - dramatically scale back or avoid new positions altogether. This isn't conservative paranoia; it's mathematical recognition that poor-quality conditions systematically work against options strategies regardless of directional accuracy.
The Patience Advantage
Most traders implement strategies the moment they spot technical opportunities, treating execution quality as a constant rather than a variable. The dual-curve approach introduces a different timing discipline. You might identify a perfect volatility trade setup, but if Reality and Fiction curves show significant divergence, waiting for alignment often produces better net results than immediate execution.
This patience feels counterintuitive because you're essentially ignoring profitable setups, but the mathematics work in your favor. Better execution during higher-quality periods more than compensates for missing some opportunities during poor-quality periods. You trade less frequently but with higher probability of execution matching your analysis.
Risk Management Through Data Quality
Here's where the confidence intervals become genuinely useful rather than just academic decoration. Instead of setting stop-losses based on arbitrary technical levels or percentage moves, you can use the bandwidth signals as early warning indicators. When confidence intervals start widening on existing positions, that's often your signal to start thinking about exits before price action confirms problems.
Conversely, tight confidence intervals during normal market noise suggest holding positions through temporary volatility. The data quality tells you when to trust your analysis and when to question it, creating more responsive risk management than static rules based on price movements alone.
Building Portfolios Around Market Conditions
The framework naturally leads to portfolio construction that varies with market quality rather than following fixed allocation rules. During high-quality periods, you can maintain larger options exposure across more complex strategies. During poor-quality periods, you shift toward simpler positioning or defensive strategies that perform better under uncertain execution conditions.
This creates natural portfolio breathing that adapts to market structure changes rather than fighting them. You're not trying to force consistent returns through all market conditions; you're accepting higher activity during favorable periods and lower activity during challenging periods. The quality assessment provides objective criteria for these transitions rather than relying on subjective market feel.
Case Studies from Live Market Data
Real market examples demonstrate how the Enhanced IV Term Structure Intelligence reveals trading opportunities and risks invisible in traditional single-curve analysis.
Case Study 1: BTC Optimal Conditions Analysis
The BTC analysis captured during high-quality market conditions demonstrates the system under ideal circumstances. With Reality and Fiction curves showing 0.1% average divergence across all expiration points, traders could implement complex strategies with confidence that execution would match analytical expectations.
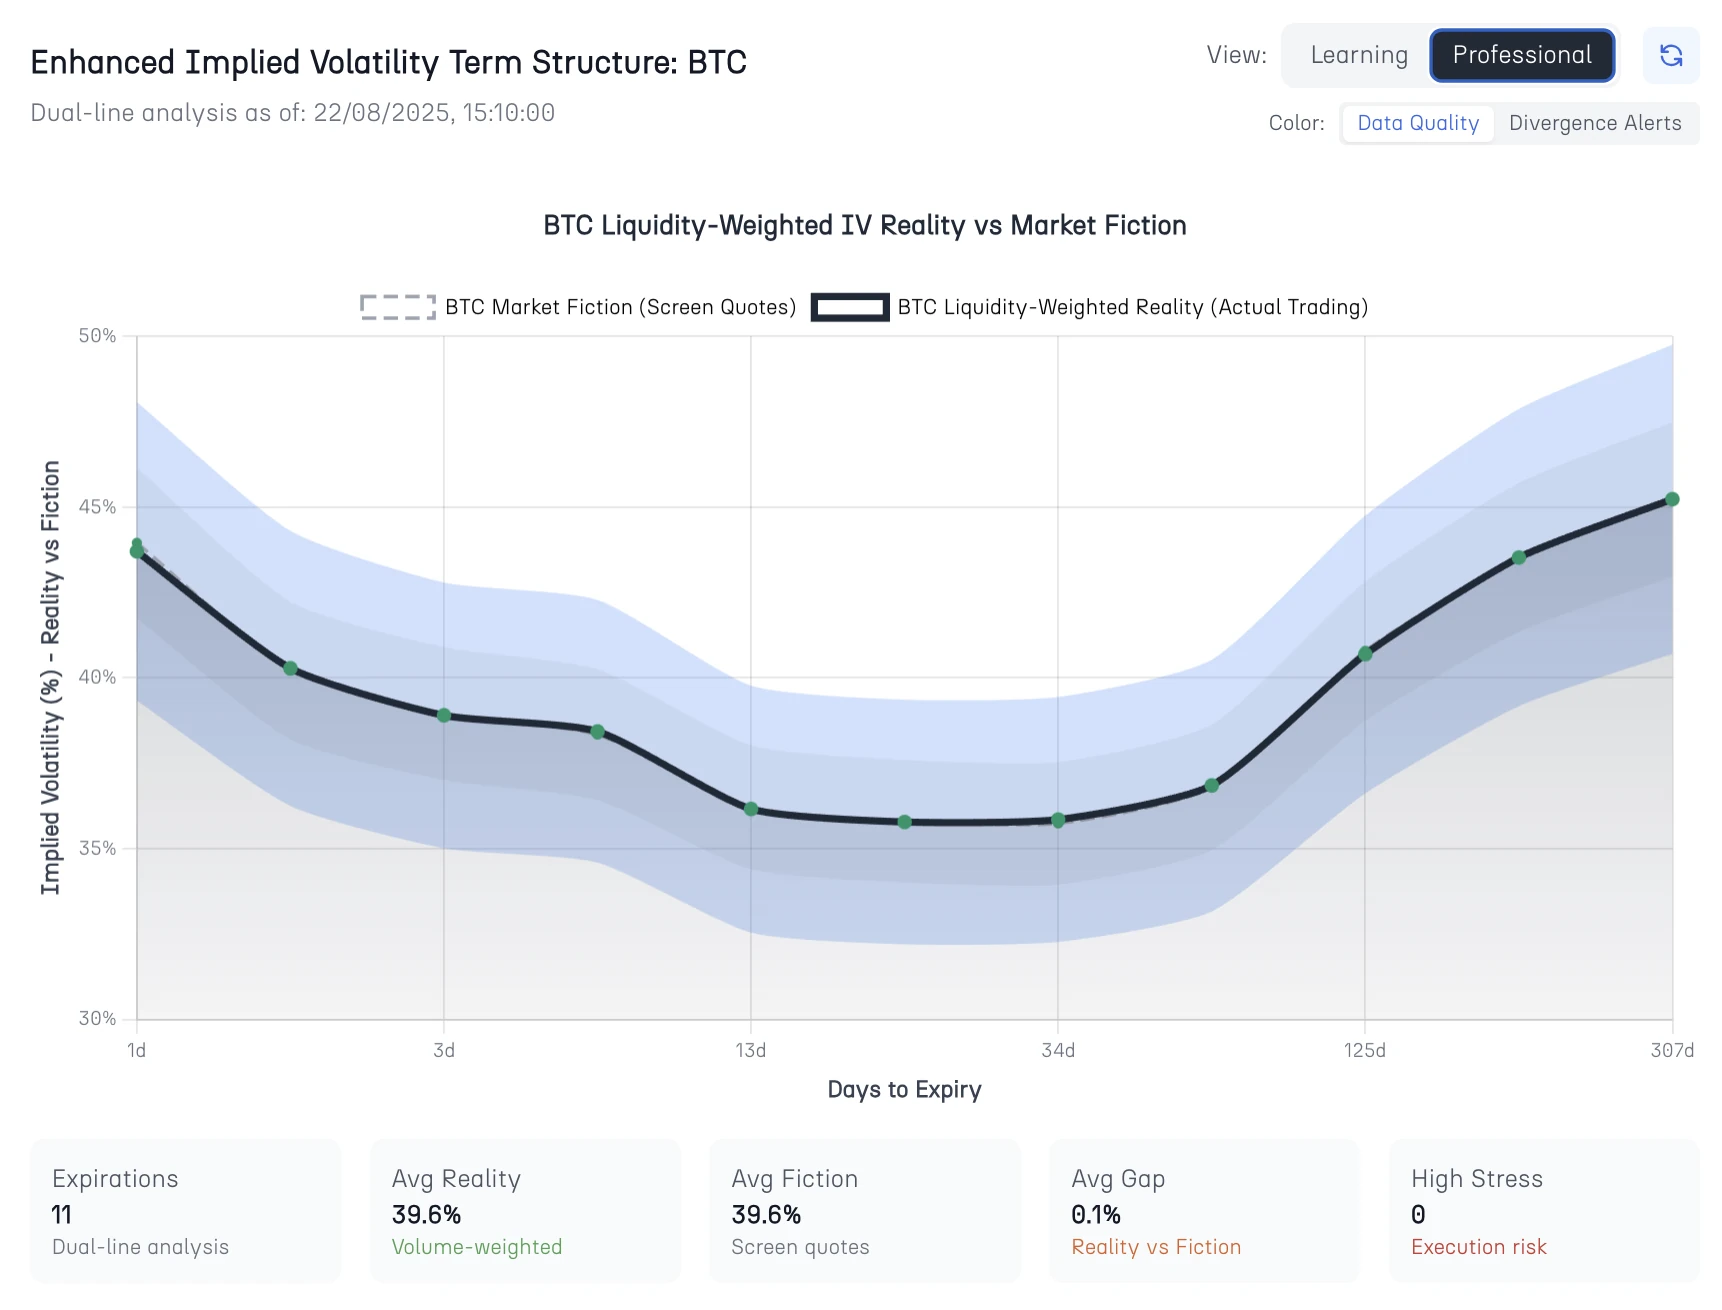
Figure 3: BTC Term-Structure under Optimal Conditions
Key observations from this period:
- Volume Support: Over $13 million in daily options volume across monitored expirations
- Quality Consistency: All expiration points achieved Professional or Institutional grade classification
- Execution Confidence: Tight confidence intervals indicating reliable price discovery
- Strategy Implications: Optimal conditions for volatility selling, complex spreads, and systematic strategies
Case Study 2: XRP Market Stress Analysis
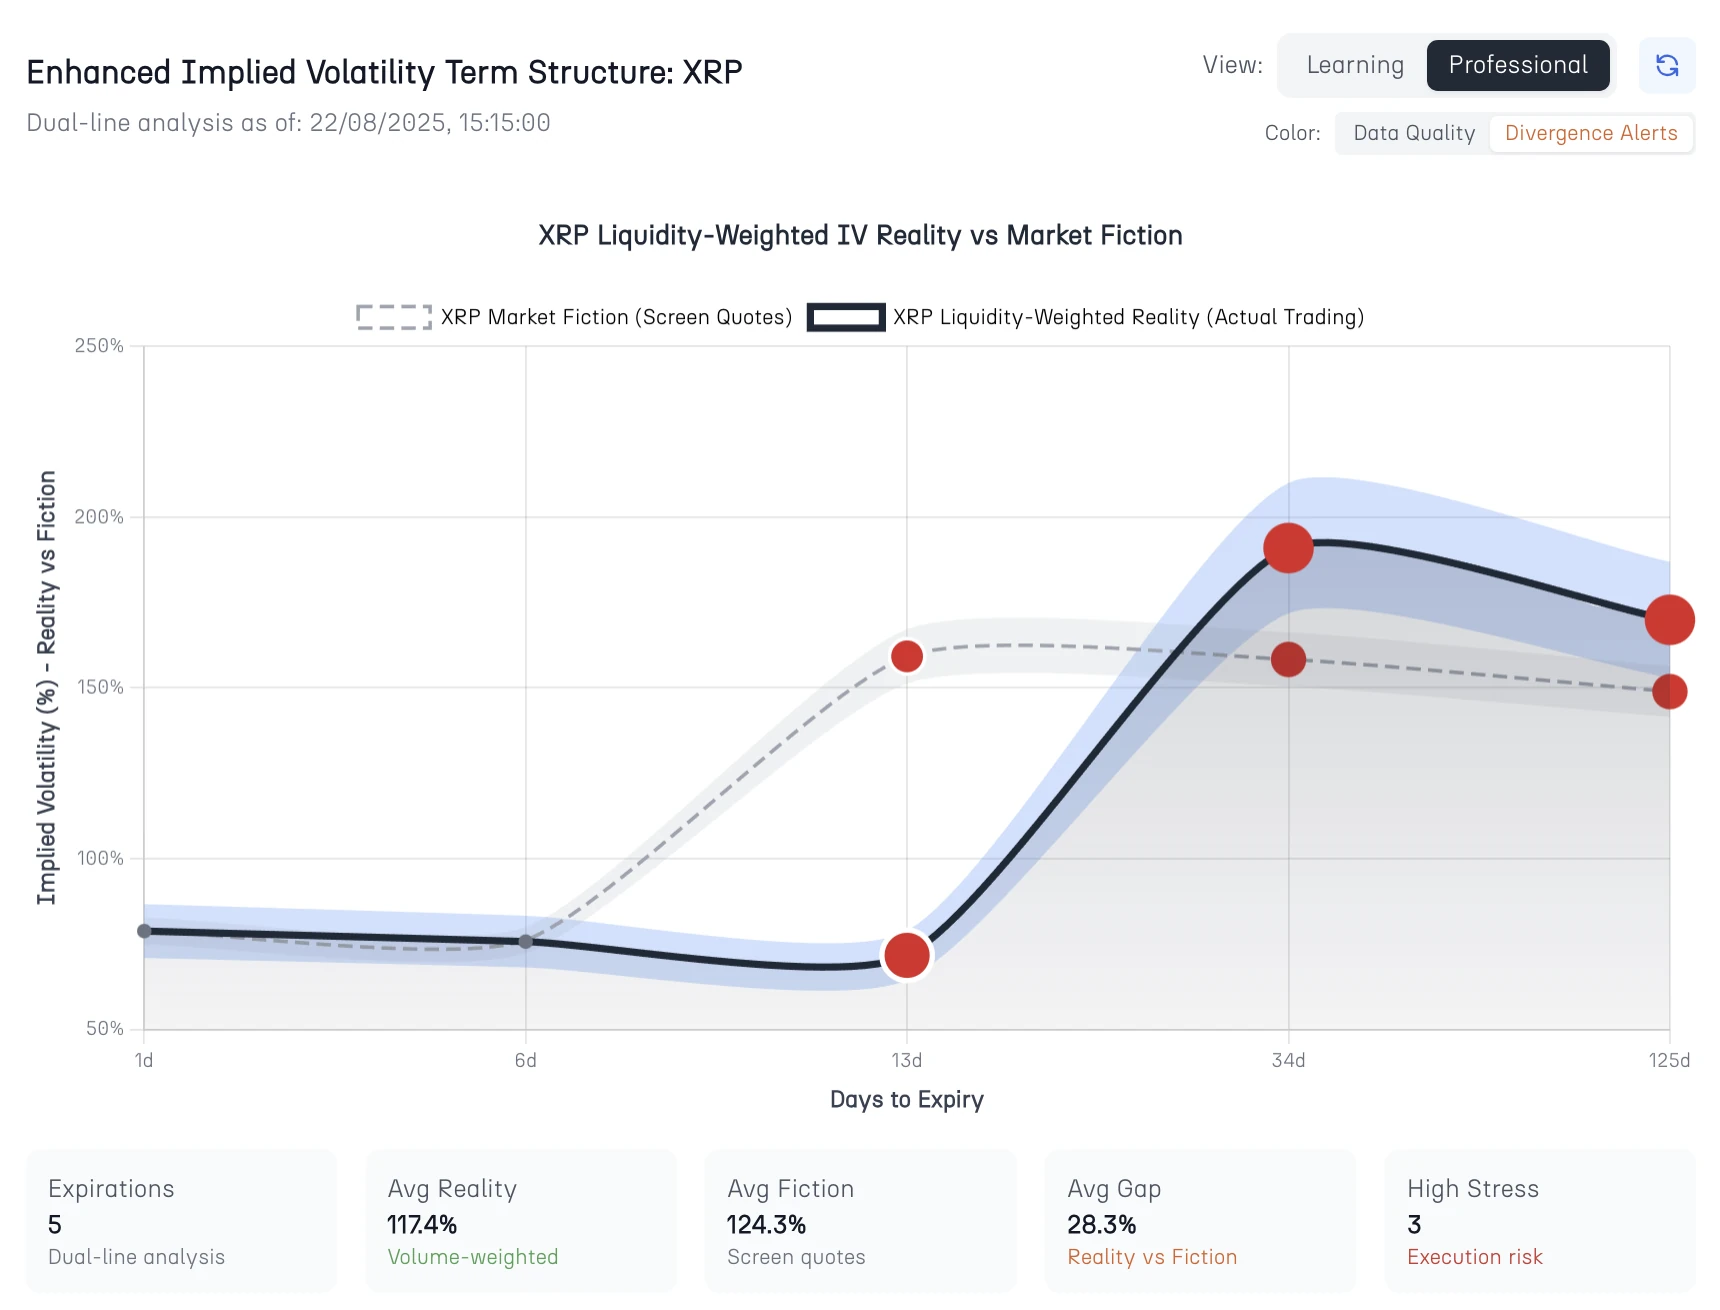
Figure 4: XRP Market Stress - Extreme Divergence Alert with 28.3% Reality vs Fiction Gap
The XRP stress analysis reveals market breakdown conditions where traditional IV analysis becomes dangerous for trading decisions. The 28.3% average divergence between Reality and Fiction curves signals extreme market dysfunction.
Critical insights from this stressed period:
- Execution Risk: Three expiration points showing high execution difficulty with red alert indicators
- Quality Degradation: Data quality drops to research grade or monitor-only classifications
- Confidence Breakdown: Massive confidence interval widening indicating extreme uncertainty
- Strategy Implications: Avoid new strategies, consider defensive positioning, reduce existing exposure
The contrast between optimal BTC conditions and stressed XRP conditions demonstrates why static analytical frameworks fail in dynamic markets. The Enhanced IV intelligence adapts to market conditions, providing appropriate guidance across the full spectrum of market quality.
Case Study 3: Quality Toggle Analysis for XRP
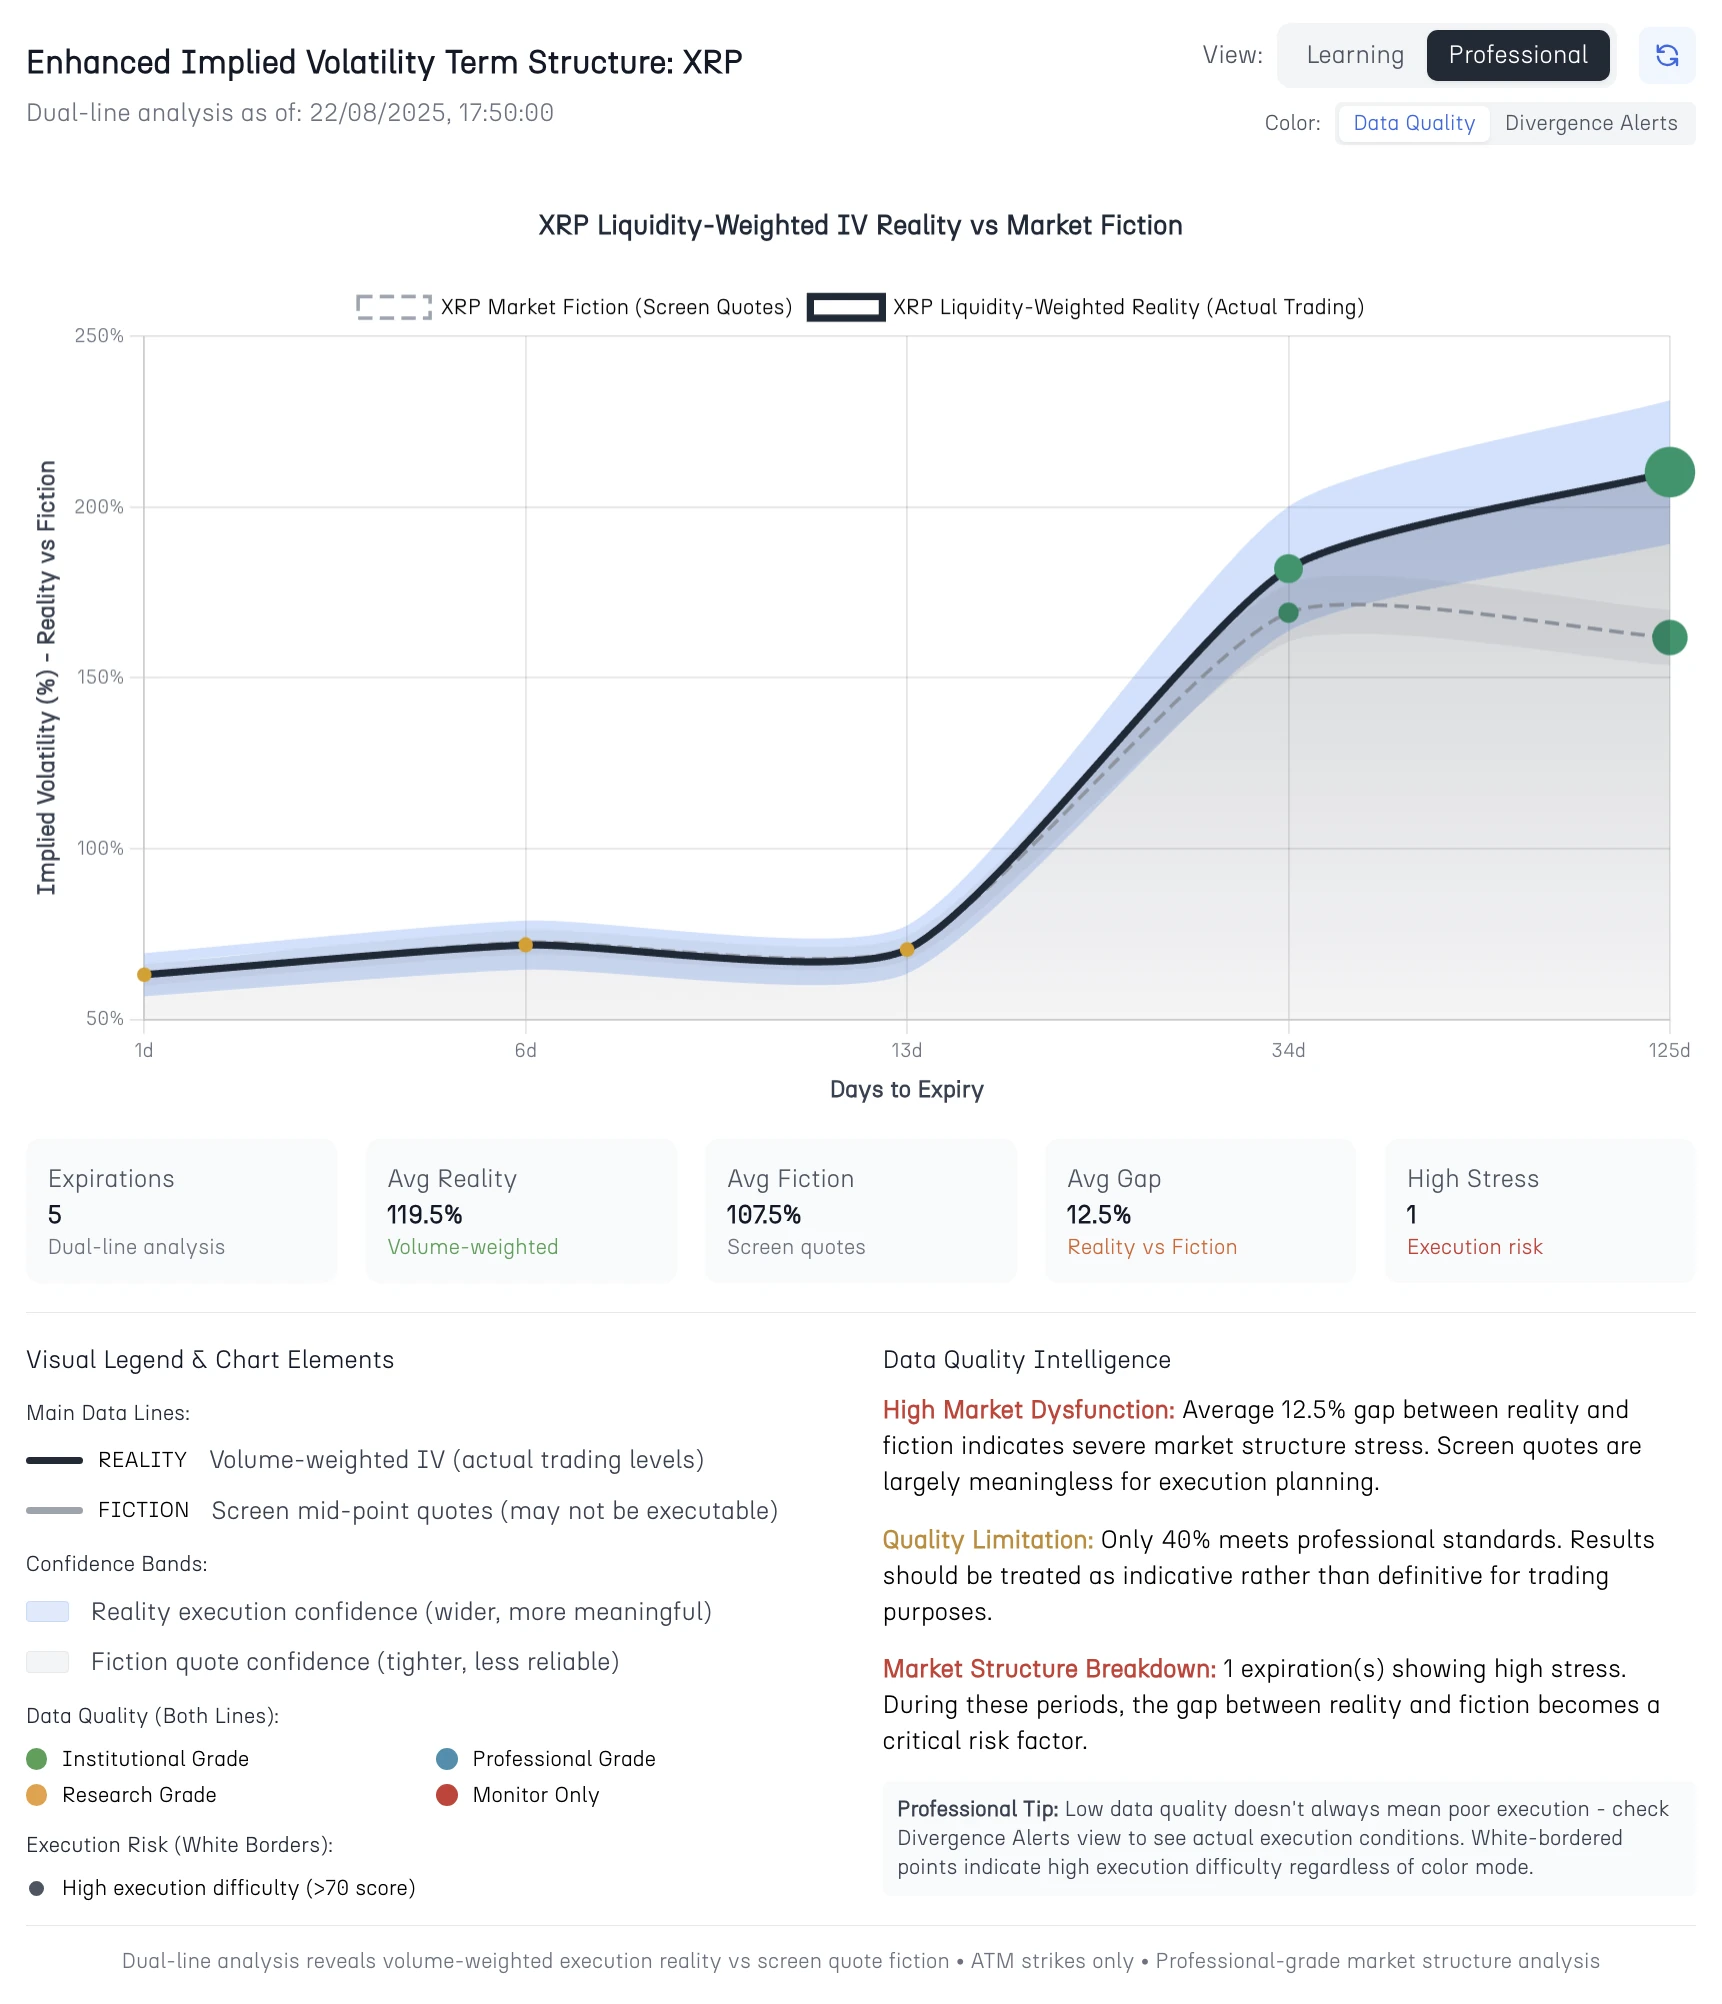
Figure 5: XRP Quality Mode - Data Quality Assessment with Institutional Grade Classification
The same XRP data viewed through Data Quality mode rather than Divergence Alerts reveals different analytical insights. While maintaining the same underlying market conditions, the quality coloring highlights data reliability patterns that support different aspects of trading decision-making.
This demonstrates the flexibility of the analytical framework in supporting different trading perspectives and decision-making priorities while maintaining consistency in underlying market assessment.
Practical Takeaways from Live Data:
The live market examples reveal several consistent patterns that traders can incorporate into systematic approaches:
-
Quality Clustering: High-quality conditions tend to persist across multiple expiration points, suggesting systematic rather than random quality patterns.
-
Volume Correlation: Higher trading volumes consistently correlate with better Reality vs Fiction alignment and tighter confidence intervals.
-
Stress Amplification: Market stress conditions create non-linear increases in execution uncertainty, making gradual position reduction more effective than threshold-based approaches.
-
Recovery Patterns: Quality improvements often occur gradually rather than instantaneously, suggesting patience in rebuilding positions after stress periods.
These patterns provide the foundation for systematic integration of quality-weighted volatility analysis into existing trading frameworks, enabling more sophisticated risk management and strategy selection processes.
Ready to evolve beyond single-curve thinking?
Experience Enhanced IV Term Structure Intelligence with both Learning and Professional modes at cayolargo.fi/enhanced-iv-term-structure – featuring live dual-curve analysis for BTC, ETH, SOL, and XRP options.
The Cayø Largo intelligence engine transforms options education and professional trading by revealing the execution reality hidden behind traditional volatility curves, enabling smarter decisions through dual-line market intelligence.
Frequently Asked Questions
Why do options traders need two IV curves instead of one?
Traditional IV curves show theoretical mid-points that may not be executable. The dual-curve system reveals both what traders see on screens (Fiction) and what they can actually execute (Reality), with the gap between them indicating execution costs and market quality.
What's the difference between Learning and Professional modes in IV analysis?
Learning mode simplifies complex volatility intelligence into educational guidance with clear execution warnings. Professional mode provides institutional-grade analysis with confidence intervals, quality scoring, and advanced market microstructure intelligence.
How do confidence intervals help in IV term structure analysis?
Confidence intervals show the reliability range around each volatility point. Tight intervals indicate high-quality data suitable for larger positions, while wide intervals warn of execution uncertainty requiring position size reduction or strategy avoidance.
What causes large gaps between Reality and Fiction IV curves?
Market stress, thin liquidity, algorithmic quoting, and institutional flow imbalances create divergence between displayed quotes and executable levels. The system automatically detects these conditions and adjusts analysis accordingly.
How does quality-weighted IV analysis improve trading decisions?
By weighting implied volatility data based on actual trading volume and reliability scores, traders get more accurate market consensus rather than being misled by thin quotes or theoretical pricing that disappears under execution pressure.