Crypto-Greeks: Delta
Learn Delta through interactive exploration of live Bitcoin and Ethereum options data. Discover how Delta predicts price movements, understand moneyness relationships, and master the probability interpretation that makes Delta your most powerful trading tool.
"Delta is not just a number. It's your options portfolio's directional DNA."
Delta stands as the most intuitive and immediately practical of all options Greeks. While other Greeks measure sensitivity to volatility, time, or interest rates, Delta answers the fundamental question every options trader needs to know: "How much will my position gain or lose if Bitcoin moves $1000 higher?"
Technically, Delta (Δ) is defined as the rate of change of an option's premium relative to a change in the price of the underlying asset. It is the first derivative of the option's value with respect to the underlying price. This is expressed mathematically as:
where
- is the change in the option's value (premium);
- is the change in the underlying asset's price.
In practical terms, this formula translates into a multiplier. For example, if a Bitcoin call option has a Delta of 0.60, it means that for every $1,000 increase in Bitcoin's price, the value of that option will theoretically gain approximately 0.60 × $1,000 = $600. This quantifies the directional exposure of your position directly.
Here is the interactive guide which transforms Delta from abstract concept to practical mastery through real-time exploration of live Bitcoin and Ethereum options data from Deribit exchange. Rather than memorizing formula, you will discover Delta's behavior by manipulating actual market conditions and watching the consequences unfold through this mini system that demonstrates delta predictions playing out against actual market movements:
Interactive Delta Education
Master options Delta through hands-on exploration of real crypto market data
Step 1: Delta in Action
Start your Delta journey by seeing how it works in practice. Select different options and timeframes to watch Delta predictions play out against actual market movements.
Key Takeaway:
Delta tells you how much an option price changes when the underlying moves $1
Delta Analysis - Real Market Data
Real option contracts with live market data
Real Market Data Analysis
Real Contract Comparison: Compare delta performance across actual traded option contracts. All data comes directly from Deribit exchange market data.
Long-term Accuracy: The % accuracy represents performance across extended historical periods, providing insight into delta's overall reliability in crypto markets.
Live Market Data: Each bar represents real options with actual strikes, deltas, and trading activity. Values shown are absolute magnitudes of price movements ($ predicted vs $ actual).
💡 Note: Accuracy values differ between modes by design - comparison mode shows long-term historical performance while tracking mode shows recent period performance.
1. Delta in Action
The system operates through two complementary modes that each reveal different aspects of how delta works in practice. The comparison mode provides a broad view across multiple option contracts, while the tracking mode offers deep insight into how delta behavior evolves over time for a specific contract.
1.1. Comparison View
The comparison mode functions like taking a snapshot of the entire options market at a single moment. You can see how delta predictions perform across different strikes, expirations, and market conditions simultaneously. To limit this view, we only display the top 3 most liquid and active call and put options as examined over the past 6 or 24 hour period, traded on Deribit exchange.
Delta prediction shows how much the system expects an option's price to change based purely on the underlying asset's price movement. The green bars show what actually happened to option prices during the same period. This creates a direct comparison between mathematical theory and market reality. When the blue and green bars align closely, delta is performing as expected. When they diverge significantly, it reveals either unusual market conditions or limitations in the delta approximation.
Here is an example of most influential options at the time of writing this article:
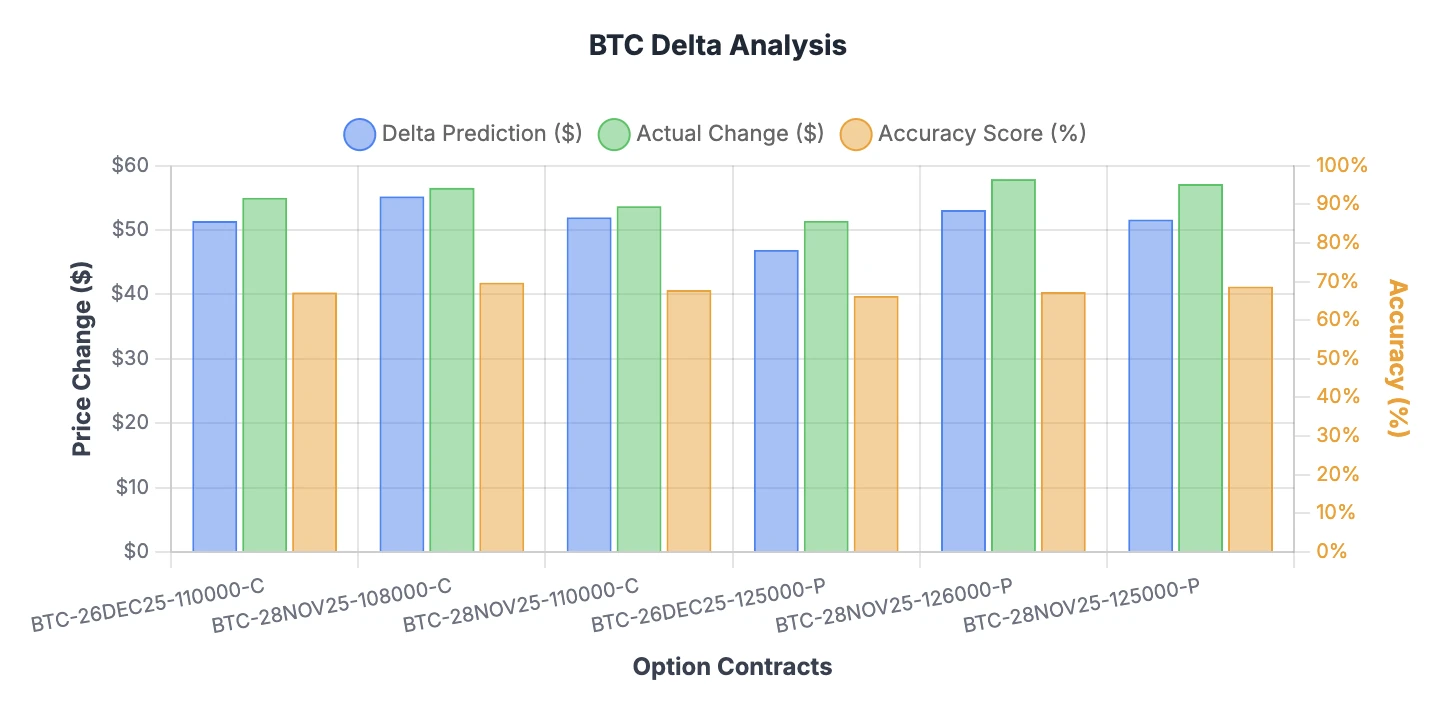
Figure 1: BTC top 3 call and put options and their Deltas' predictions and actual changes. The average accuracy of 67.8% suggests quite optimistic this Greek power taken in isolation.
1.2. What Delta "Prediction" Actually Measures
It's crucial to understand that this analysis is retrospective backtesting, not real-time predictive capability. The delta prediction shows how much an option's price should have changed based on the underlying asset's actual price movement that already occurred. This is fundamentally different from making forward-looking predictions.
At any given moment (say 05:50), a trader knows:
- Current Δ (-0.6037)
- Current BTC price ($95,652)
- But NOT the future BTC price at 06:00 ($96,600)
The accuracy, say 72.3%, isn't measuring prediction skill. It's measuring how well delta explains option price changes when you already know what the underlying price movement was.
1.3. Time-Series Analysis Through Real-Time Tracking
The tracking chart transforms delta education from static concepts into dynamic understanding. Here the accuracy line's fluctuations over time reveals how market conditions affect delta reliability. During periods of smooth price movement, accuracy typically improves. During volatile periods or around major news events, accuracy often deteriorates as markets behave less predictably.
The 76.1% average accuracy achieved in the tracking example (BTC-26DEC25-125000-P) represents remarkably strong performance for real market conditions. This high accuracy validates that delta provides valuable predictive power while simultaneously demonstrating that it's not perfect. The 70 out of 143 instances of high accuracy (above 80%) show that under optimal conditions, delta predictions can be extremely reliable.
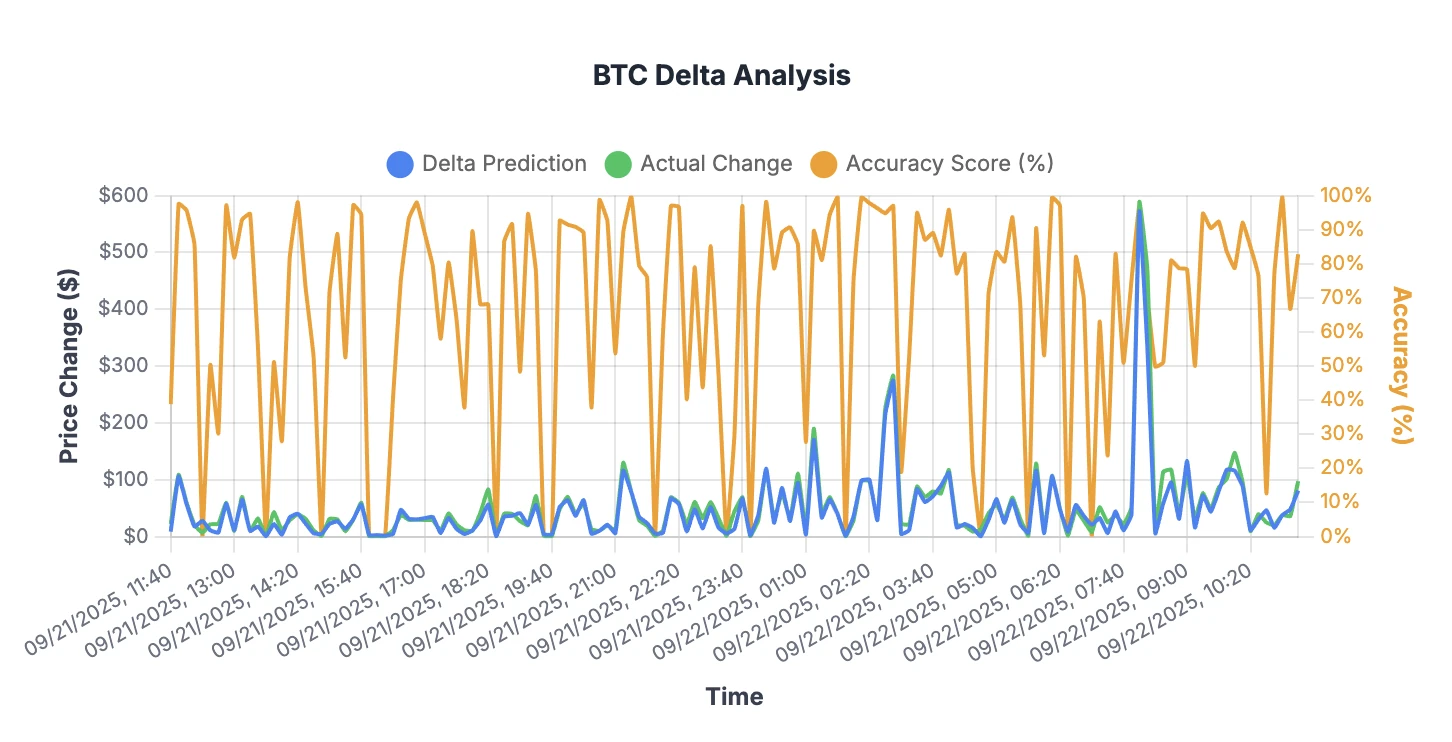
Figure 2: Tracking Delta prediction vs actual option prices changes for BTC-26DEC25-125000-P contract.
2. Delta Curve Analysis
The Delta curve provides a comprehensive view of market probability assessments across all strike prices. Rather than examining individual options in isolation, the curve reveals how the market collectively assesses the likelihood of different price outcomes at expiration. This transforms abstract Greek values into intuitive probability landscapes that reveal market expectations.
The mathematical foundation underlying these curves demonstrates how delta values directly translate into market-implied probabilities. Each data point represents the most recent delta from Deribit's real-time market data. However, not an average across multiple contracts but the actual hedge ratio calculated by market makers using Black-Scholes parameters.
For call options, the probability simply equals delta multiplied by 100, while put options use the absolute value of their negative deltas. This relationship stems from the Black-Scholes model where delta approximates N(d₂), the risk-neutral probability of finishing in-the-money.
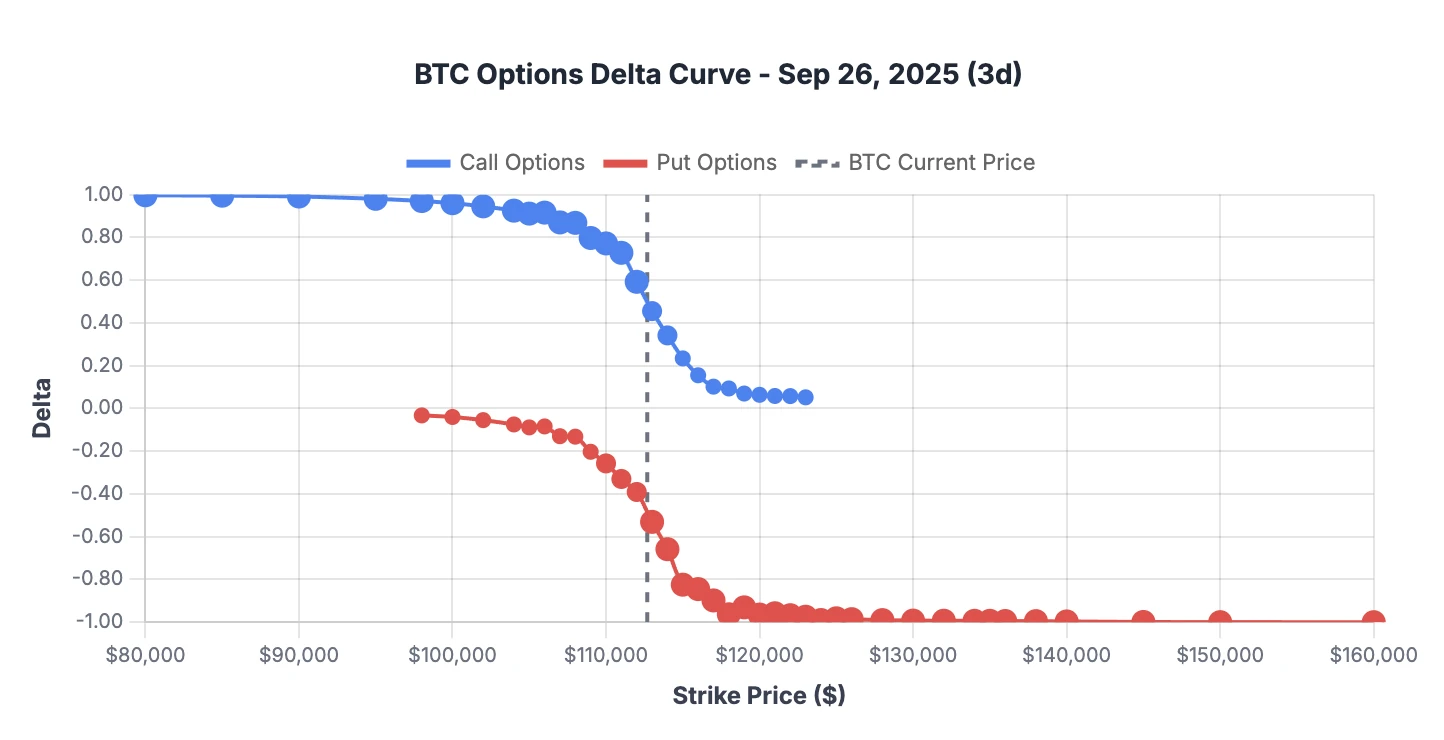
Figure 3: Delta Curve for BTC options expiring on Dec 26, 2025.
Figure 3 illustrates a classic short-dated delta curve for September 26, 2025 expiration (in 3 days!), showing the characteristic steep transitions around the current BTC price of approximately $112,000. With limited time remaining, the probability assessments become binary, i.e. strikes are either very likely to finish in-the-money (delta near ±1.0) or very unlikely (delta near 0).
The "Sep 26, 2025 (122 options)" referenced in the interface represents the total count of available strike prices and option types (calls and puts combined) for this specific expiration, each contributing a single data point to construct this probability landscape.
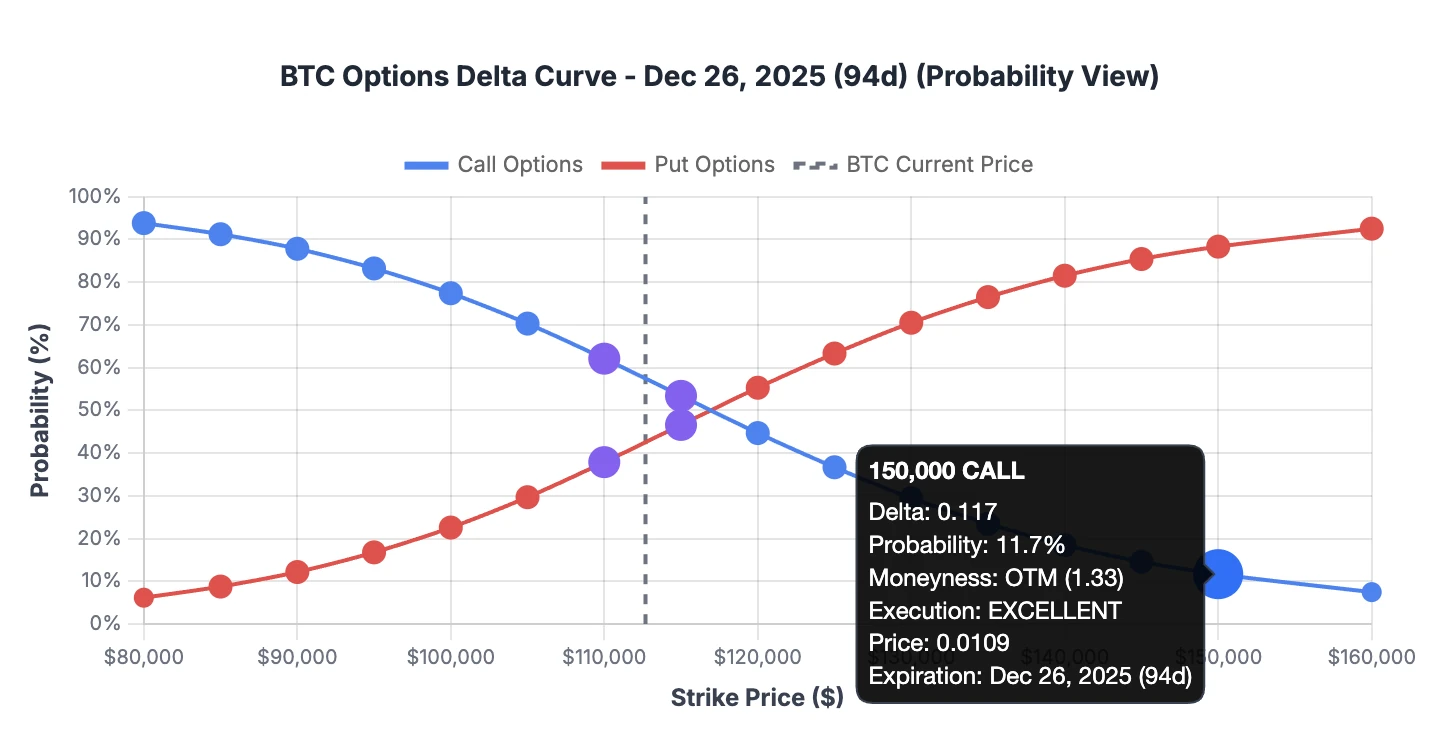
Figure 4: Probabilistic view of Delta Curve.
Now, the contrast becomes striking when we examine longer-dated options, as shown in Figure 4 for Dec 26, 2025 expiration (94 days to expiration). Here, the curves exhibit gentler slopes and more distributed probabilities, reflecting the increased uncertainty over longer time horizons.
The highlighted 150,000 call option demonstrates this beautifully: with a delta of 0.117, the market assigns an 11.7% probability that BTC will exceed $150,000 by Christmas 2025. This would require a 33% price appreciation from current levels. This moneyness ratio of 1.33 quantifies exactly how far out-of-the-money this strike sits.
The transformation from the traditional delta view to probability percentages revealsmarket sentiment in intuitive terms. Rather than interpreting abstract Greek values, traders can immediately grasp that the market sees roughly a 1-in-9 chance of BTC reaching $150,000 within 94 days. This probability-based interpretation makes the delta curve an invaluable tool for assessing market expectations, identifying mispriced options, and constructing strategies based on directional convictions relative to market consensus.
3. Delta as a Probability Predictor
The ultimate validation of delta's probability claims comes from analyzing expired options against their actual outcomes. Using 534 real Bitcoin options from Deribit exchange, this analysis examines whether delta's probability predictions matched reality.
In other words, essentially, we test whether a "70% delta" option actually finished in-the-money 70% of the time. The methodology is straightforward: take options that expired 2-4 days after their delta measurements, determine their final outcomes, then compare predicted versus actual success rates across different delta ranges.
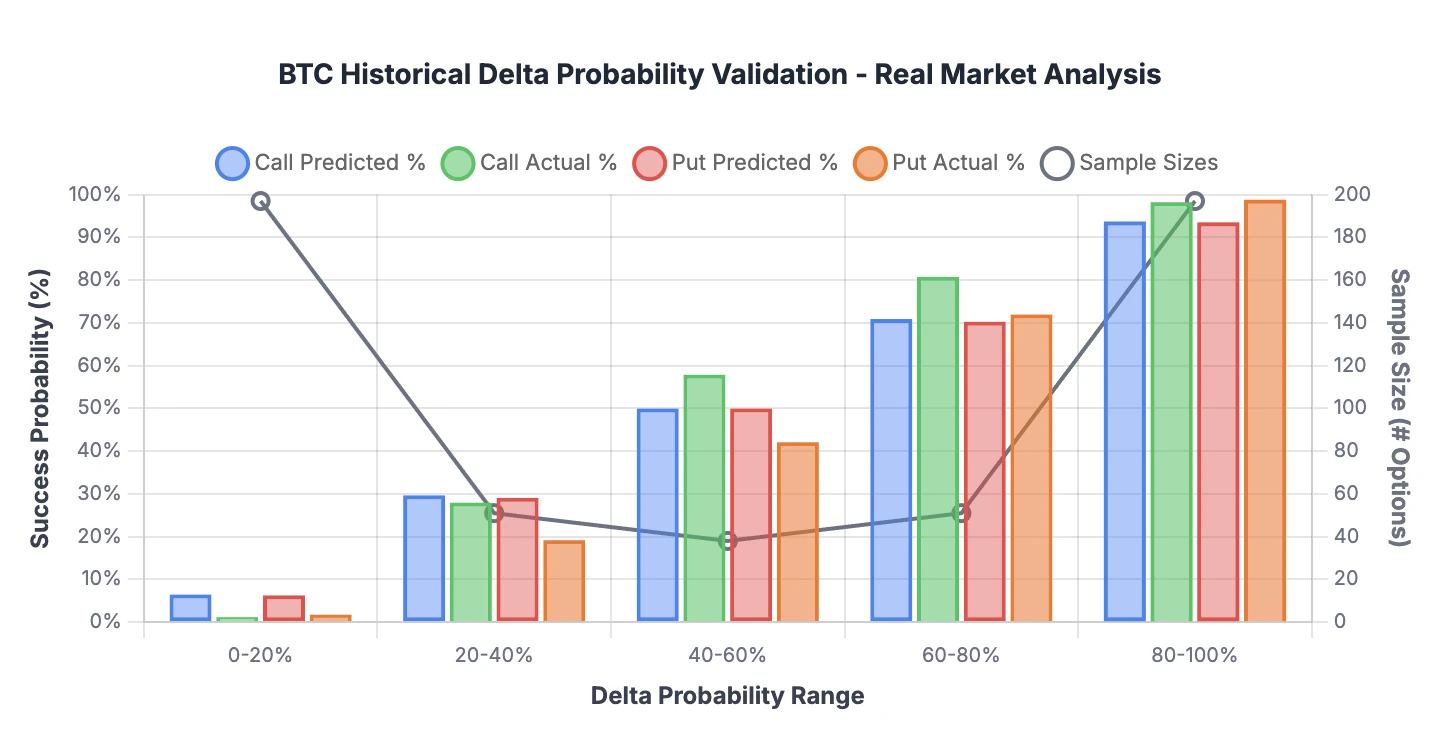
Figure 5: Historical Delta Probability Validation for BTC over the past 6 months of data.
The results reveal delta's reliability varies dramatically by probability range, as shown in the historical validation chart. Low-delta options (0-20% range) performed exactly as expected, with minimal success rates confirming delta's pessimistic predictions. The middle ranges tell a more complex story: delta appears overly conservative in the 40-60% range, where actual success rates significantly exceeded predictions, particularly for calls at 58% actual versus 50% predicted. This suggests opportunities may exist where delta underestimates probability.
The 80-100% range emerges as delta's most reliable territory, earning the "Best Range" designation with predictions closely matching outcomes. However, a striking asymmetry appears between option types: calls demonstrate 63.3% prediction accuracy while puts achieve only 50.9%. This disparity reflects Bitcoin's underlying upward bias, where call options benefit from long-term price appreciation while puts fight against the trend, making their delta-based probabilities less dependable in practice.
The overall accuracy of 57.1% positions delta as a useful but imperfect probability tool. Well, better than random chance but requiring careful application. For practical trading, these findings suggest increasing position confidence in high-delta scenarios (80-100% range) where predictions prove most reliable, while exercising caution in moderate ranges where delta's conservatism may obscure genuine opportunities. The superior accuracy of call predictions also implies that in trending assets like Bitcoin, upside probability estimates carry more weight than downside projections.
4. Understanding Delta's Breakdown Patterns: When Predictions Fail
The most practical question for options traders is determining when delta becomes unreliable during actual price movements. This breakdown analysis examines 534 real market data points from Deribit to identify the precise thresholds where delta predictions fail. Surprisingly it reveals counterintuitive patterns that challenge conventional hedging wisdom.
The analysis measures delta's accuracy in predicting option price changes across different Bitcoin price movement magnitudes, with accuracy calculated by comparing delta-predicted option price changes against actual market outcomes.
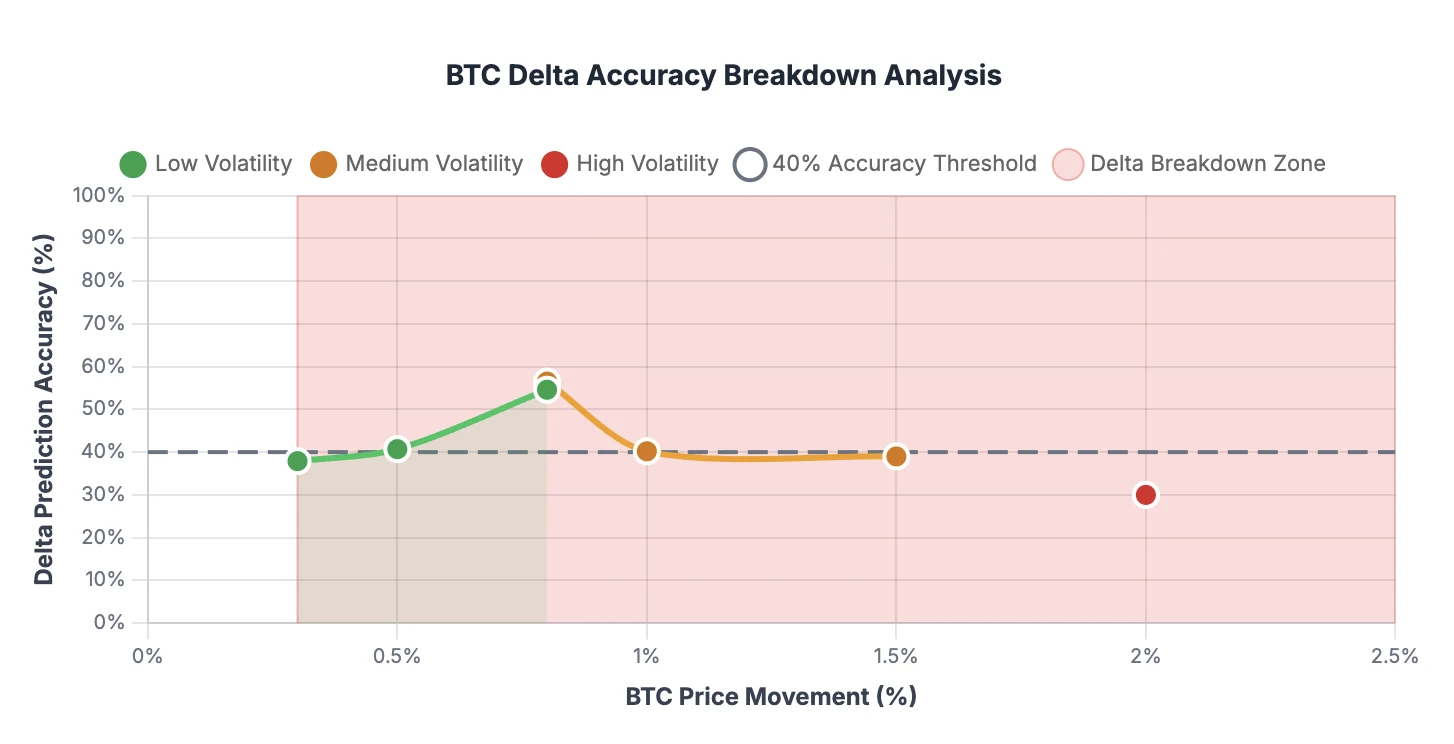
Figure 6: Delta's Breakdown for BTC.
The results uncovers an unexpected U-shaped reliability pattern across price movements. Small movements under 0.8% show unexpectedly poor delta accuracy of 35-50%, primarily due to market noise overwhelming delta's linear predictions (random supply and demand fluctuations create price changes that delta's mathematical model cannot effectively capture). The optimal performance zone emerges around 0.8-1.0% price movements, where accuracy peaks near 60%, representing the sweet spot where movements are large enough to overcome noise but not so large that higher-order Greek effects dominate.
Volatility regime classification adds crucial context to these patterns. The system categorizes six-hour movements into Low Volatility (under 0.6%), Medium Volatility (0.6-1.5%), and High Volatility (above 1.5%), with each regime showing distinct delta reliability characteristics. The colored lines demonstrate that market stress itself, not just movement magnitude, affects delta performance. High volatility periods show delta failing even during relatively modest price changes, while low volatility environments maintain better delta reliability across movement ranges.
The practical implications establish clear trading guidelines based on movement thresholds. The 0.3% breakdown point indicates that 46.0% of price movements fall into the "small moves" category where delta reliability remains questionable, while 34.5% qualify as "large moves" where delta accuracy drops below 40%.
For position management, treat movements under 1.0% as the "delta-safe" zone for traditional hedging strategies, monitor gamma exposure carefully between 1.0-1.5%, and above 1.5% consider delta fundamentally unreliable, shifting to sophisticated risk management incorporating gamma, vanna, and higher-order Greeks to maintain effective hedging.
Frequently Asked Questions
What is Delta in crypto options and why is it important?
Delta measures how much an option's price changes relative to a $1 move in the underlying cryptocurrency. For example, a BTC call option with 0.75 Delta will gain approximately $0.75 when Bitcoin rises by $1. Delta is crucial for understanding directional risk and position sizing.
How do you interpret Delta as probability in crypto options?
Delta approximates the probability an option will expire in-the-money. A 0.65 Delta BTC call has roughly 65% chance of being profitable at expiration, while a -0.30 Delta ETH put has about 30% chance of finishing in-the-money.
Why do crypto options Delta behave differently from traditional markets?
Crypto's 24/7 trading eliminates weekend gap risk, but higher volatility makes Delta less accurate for large price movements. Bitcoin and Ethereum's price swings can cause Delta to change rapidly, requiring more frequent position adjustments.
How does moneyness affect Delta in Bitcoin and Ethereum options?
At-the-money options have Delta near ±0.50. In-the-money calls approach +1.0 Delta while out-of-the-money calls approach 0. For puts, in-the-money strikes approach -1.0 Delta while out-of-the-money puts approach 0.