Straddle Strike Selection Problem: using Droplet and Surface Crypto-Greeks
Discover how novel surface dynamics Greeks (Droplet, Surface Vanna, Surface Charm) optimize straddle strike selection across short, medium, and long-term horizons. Includes interactive backtesting, P&L decomposition, and case studies revealing when Greek-based selection adds genuine edge versus when macro events dominate.
"Five strikes near $107,000, costs within 2%. One captures volatility beautifully but bleeds theta aggressively. Another resists decay but fumbles volatility spikes. For straddles, strike selection determines whether theta decay or volatility expansion wins."
1. The Straddle Strike Dilemma
You stare at your trading screen. Bitcoin hovers near $107,000, and you sense significant movement approaching. Perhaps regulatory clarity emerges within days. Perhaps Donald Trump's unpredicted mood pushes all market south again. Perhaps institutional flows accelerate over weeks. Perhaps... You decide to buy a straddle, profiting whether Bitcoin explodes upward or crashes downward, as long as it moves substantially. But now you face a more nuanced decision than simply choosing a strike price. You must also select your time horizon.
Traditional options education offers mechanical guidance: buy the at-the-money (ATM) strike. But this advice ignores a critical dimension, i.e. ATM for which expiration? The strike selection problem becomes exponentially more complex when you consider that identical strikes behave completely differently across short-term (14-30 days), medium-term (30-60 days), and long-term (60-120 days) horizons. Each horizon embodies distinct risk-reward characteristics, theta decay profiles, and optimal strike selection criteria.
Figure 1 below reveals this multi-dimensional complexity. The tool that we have build (see Section 7), it displaysoptimal straddle strikes across three time horizons simultaneously. For Bitcoin at $107,000, the system evaluates all available strikes within each expiration window, scoring them through the lens of threeadvanced Greeks: Droplet (strike-volatility evolution intelligence), Surface Vanna(cross-strike volatility sensitivity), and Surface Charm (time decay quality control). Notice how the top-ranked strikes differ dramatically across horizons, even when costs appear similar.
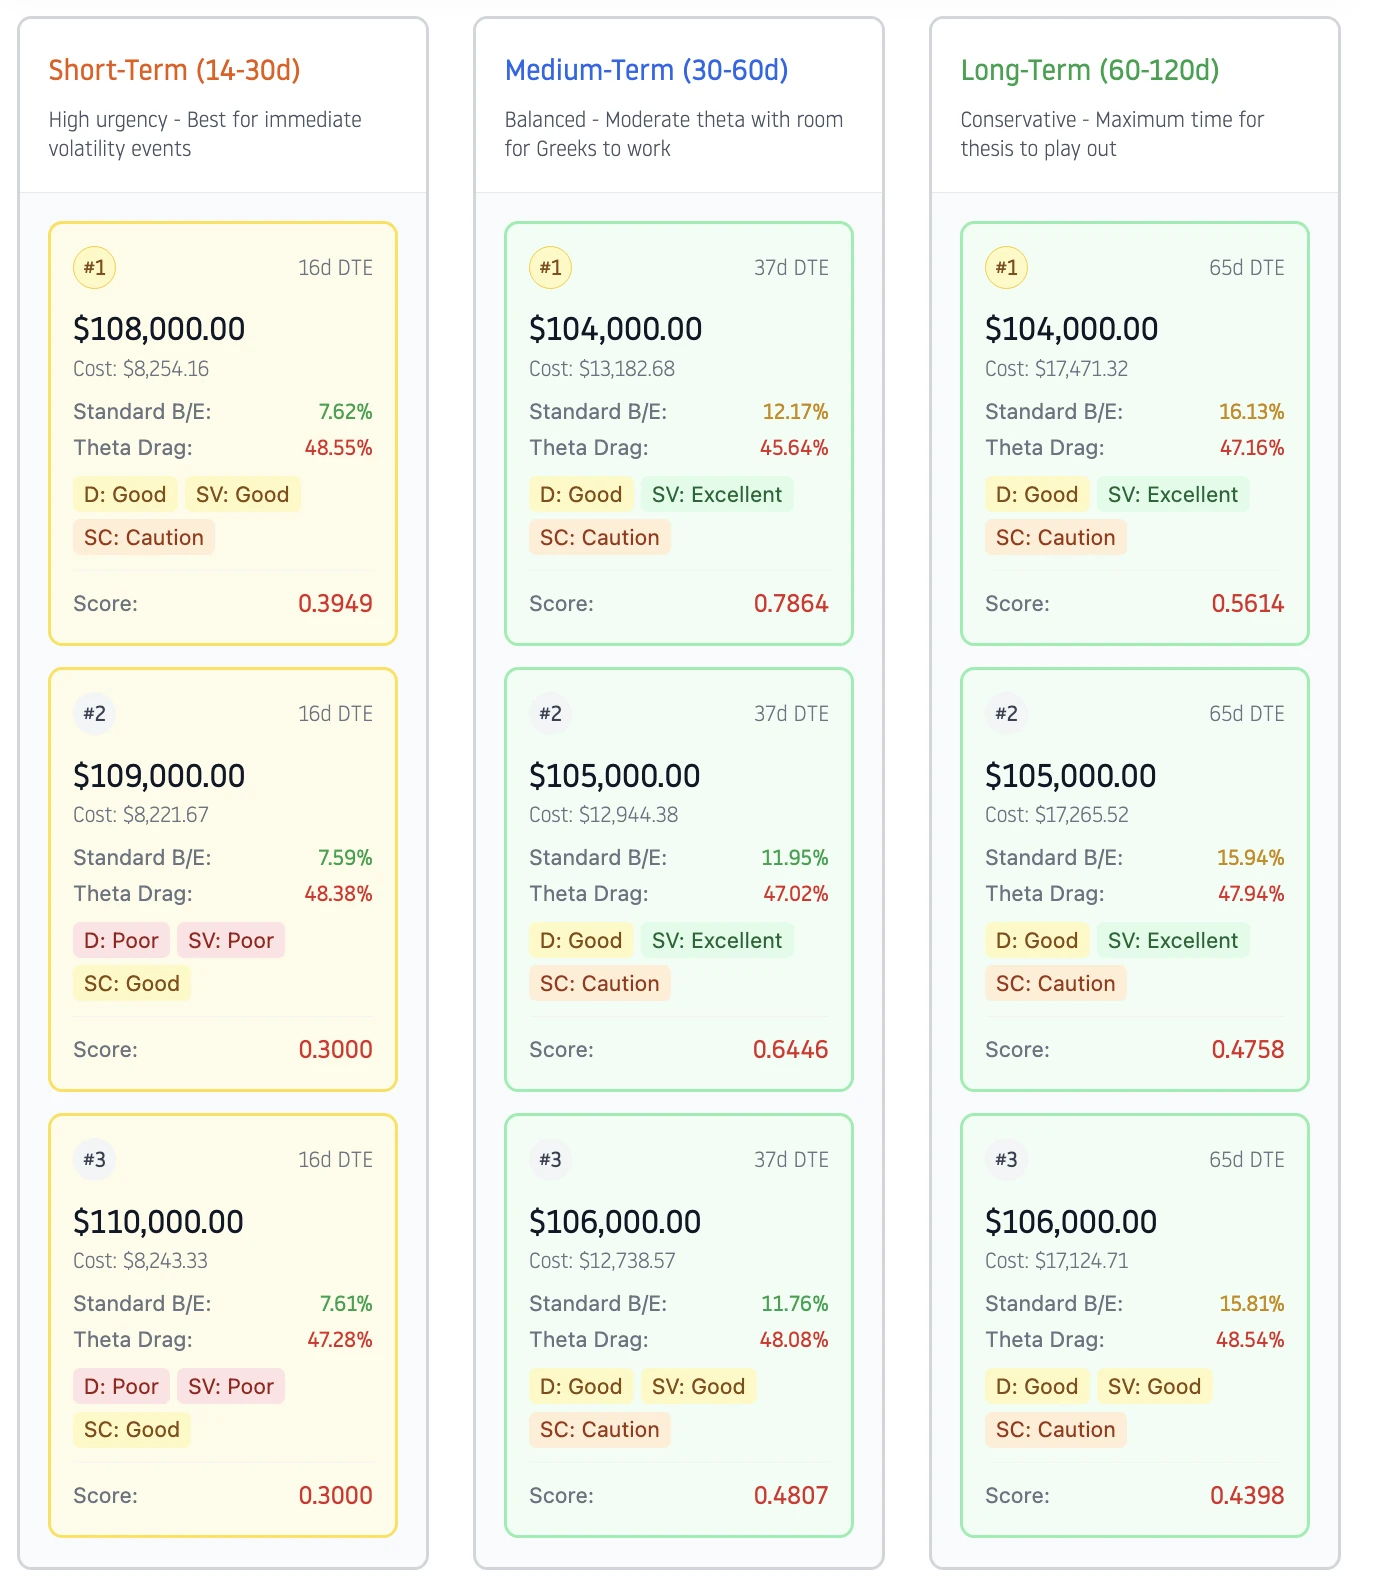
Figure 1: The Multi-Horizon Strike Selection tool evaluates optimal straddle opportunities across three distinct time windows. Short-term horizon (16d DTE) shows highest urgency with aggressive theta decay but tight break-evens. Medium-term horizon (37d DTE) balances moderate theta with adequate time for Greek dynamics. Long-term horizon (65d DTE) provides maximum time for thesis development but requires larger initial capital. Each horizon displays the top 3 ranked strikes with full Greek quality assessments, composite scores, and dual break-even metrics.
Consider the short-term horizon displaying 16 days to expiration. The top-ranked $108,000 strike costs $8,254 with a composite score of 0.3949. It shows Good ratings in both Droplet and Surface Vanna, signaling strong volatility capture characteristics. However, Surface Charm earns only Caution, warning that time decay will accelerate against you as expiration approaches. The theta drag projects 48.55% of the initial cost evaporating if no profitable Greek activity materializes. This represents high urgency: either your market view plays out within two weeks or theta destroys value regardless of Greek quality.
Now examine the medium-term horizon at 37 days to expiration. The top-ranked $104,000 strike costs significantly more at $13,183 but achieves a much higher composite score of 0.7864. It earns Good Droplet rating and Excellent Surface Vanna rating, indicating superior volatility dynamics. Surface Charm remains at Caution, but the longer runway means theta decay pressure, while still substantial at 45.64%, distributes across five additional weeks. This horizon targets traders expecting catalysts within the next month but willing to pay premium for better Greek positioning.
The long-term horizon at 65 days to expiration presents the most interesting tradeoff. The top-ranked $104,000 strike costs $17,471 (the highest initial capital requirement) but achieves only a 0.5614 composite score (lower than medium-term). It maintains GoodDroplet and Excellent Surface Vanna ratings but shows Caution Surface Charm with 47.16% theta projection. Despite the longest time frame, theta remains problematic because the adaptive weighting system recognizes that even with 65 days remaining, this strike's Surface Charm score signals accelerating decay characteristics. The long-term horizon suits traders whose market view requires months to unfold, accepting higher absolute costs for maximum time flexibility.
Here emerges the fundamental multi-dimensional tension. Do you prioritize the short-term horizon with tighter break-evens (7.62%) but catastrophic theta decay if your market view takes longer than expected? Do you select the medium-term horizon with superior Greek quality but 12.17% break-even requirements? Or do you choose the long-term horizon, accepting 16.13% break-even thresholds for maximum development time? The mechanical "buy at-the-money" rule collapses under this complexity, because identical ATM strikes behave completely differently when evaluated across time horizons.
Notice also how adaptive Greek weighting responds to each horizon's characteristics. The short-term analysis automatically shifted from standard allocation (50% Droplet, 30% Surface Vanna, 20% Surface Charm) toward a more defensive profile (increasing Surface Charm weight to 35-50%) when detecting elevated theta acceleration risk. The medium-term horizon maintains more balanced weighting because adequate time remains for Greek dynamics to manifest before decay dominates. The long-term horizon applies standard weighting initially but adjusts dynamically as strikes approach theta acceleration zones.
This article introduces a systematic framework for straddle strike selection that extends beyond simplistic ATM rules into multi-horizon optimization. The interactive tool featured throughout provides real-time analysis across BTC, ETH, SOL, and XRP, evaluating strikes through three distinct time lenses simultaneously.
You will learn to recognize when Greek-based optimization adds genuine trading edge versus when market regime makes all strikes equally mediocre across all horizons. Most importantly, you will discover that the most intelligent decision often involves not which strike or horizon to choose, but whether current conditions support straddle strategies at all or not!?
2. Understanding Straddles in Crypto Options
A straddle is one of the most elegant option strategies because it removes directional bias entirely. When you buy a straddle, you simultaneously purchase both a call and a put at the same strike price with identical expiration dates. This creates a position that profits from significant price movement in either direction, or from increases in implied volatility, without requiring you to predict market direction.
Imagine Bitcoin trades at $107,000 and you believe major movement is imminent but cannot determine whether regulatory news will push prices toward $120,000 or crash them to $90,000. A straddle solves this prediction problem. You buy the $107,000 call (valuable if prices rise) and the $107,000 put (valuable if prices fall). Your profit potential extends infinitely in both directions once movement exceeds the premium paid for both options combined. Easy money, right?! Well, not so fast.
The straddle payoff forms a distinctive V-shape with maximum loss at the strike price. This equals the total premium paid. If the call costs $4,743 and put costs $4,336 (total $9,079), this represents your maximum possible loss if Bitcoin sits precisely at $107,000 at expiration. If Bitcoin rallies to $124,900, your call gains $17,900 intrinsic value while the put expires worthless, yielding $8,821 profit (97.2% return). Conversely, if Bitcoin crashes to $89,900, your put gains $17,100 intrinsic value while the call expires worthless, yielding $8,021 profit (88.3% return). The symmetry breaks down slightly because of premium differences between calls and puts.
Interactive Straddle Visualizer
Adjust the parameters below to see how straddle profitability changes with different strike prices, premiums, and market outcomes. The V-shaped curve shows your P&L at various Bitcoin prices at expiration.
Entry Parameters
Market Outcome
Current P&L
-$9,079
Return on Investment
-100.0%
What you're seeing: The V-shaped curve represents your straddle's profit or loss at different Bitcoin prices at expiration. Your maximum loss ($9,079) occurs when Bitcoin sits exactly at the strike price ($107,000). You start profiting when Bitcoin moves beyond the breakeven points: above $116,079 or below $97,921. The blue dot shows your current outcome based on the selected expiration price.
The interactive straddle visualizer above demonstrates these dynamics. Adjust strike prices and premiums to see how the V-shaped profit curve changes. Move the expiration price slider to discover breakeven points, meaning the exact prices where your straddle transitions from loss to profit. Notice how maximum loss always occurs at the strike price, but profit slope steepness depends on premium cost. Cheaper straddles have tighter breakevens and steeper profit slopes; expensive straddles require more dramatic movement for equivalent percentage returns.
Straddles profit through two distinct mechanisms:
- Realized volatility exceeding implied volatility. When actual price movement exceeds what you paid for. If you pay premiums implying 80% annualized volatility but Bitcoin realizes 120% volatility through wild swings, your straddle profits regardless of direction.
- Implied volatility expansion while holding the position. Even without significant price movement, if market participants suddenly price in greater risk (perhaps due to pending regulatory decisions), implied volatility can spike from 80% to 120%. This volatility expansion increases both option values simultaneously, allowing profitable exit despite minimal price change.
Straddles lose money through three primary mechanisms:
- Theta decay overwhelming movement. Time works against you from purchase. Options erode daily even if price and volatility remain constant. Decay accelerates dramatically as expiration approaches: with 30 days remaining you might lose 1% daily, but with 7 days remaining that decay exceeds 3% daily, and with 1 day left decay becomes catastrophic at 10%+ daily.
- Collapsing implied volatility after entry. When you buy at peak IV before mean-reversion deflates premiums. If you enter when implied volatility spikes to 120% expecting continuation, but IV collapses back to 70% within days, both option values decline simultaneously regardless of price movement.
- Directional price action without volatility expansion. When Bitcoin trends steadily in one direction with declining volatility. One leg gains from delta while the other loses, but without elevated realized volatility or IV expansion to compensate, net gains fail to overcome theta costs. Macro shocks can trigger regime changes where systematic selling pressure and collapsing volatility create the worst environment for long straddles.
The Black-Scholes framework ensures high gamma options (strong price sensitivity) exhibit high theta. You pay for convexity through accelerated decay. This gamma-theta tradeoff becomes critical when selecting strikes and horizons, because different combinations offer meaningfully different ratios of volatility capture to decay cost.
3. Novel Crypto-Greeks for Intelligent Strike Selection
Given these competing dynamics, how do you select strikes that maximize volatility capture while minimizing decay costs? The answer lies in analyzing how option sensitivities evolve across timeand volatility regimes.
At Halcyon Waters, we engineered a comprehensive Greeks Momentum Engine comprising 37 Greeks total: 17 standard Greeks from traditional derivatives theory plus 20 proprietary Greeks specifically for crypto-options markets (soon available in Cayø Largo).
Among this arsenal, three surface dynamics Greeks (Droplet, Surface Vanna, and Surface Charm) represent breakthrough innovations we are deploying publicly for the first time. Each addresses a specific dimension of straddle performance that standard Greeks cannot detect, capturing how sensitivities evolve over time and across the volatility surface. These Greeks provide valuable intelligencefor strike comparison, though they cannot predict outcomes when broader market regime factors dominate.
3.1. Droplet: Strike-Volatility Temporal Evolution
Droplet quantifies how the strike-volatility relationship evolves over time. When buying straddles expecting volatility mean-reversion, you want strikes that benefit disproportionately from volatility increases. Standard Vega tells you current gain from a one percent volatility increase. Droplet tells you whether that Vega advantage strengthens or weakens as volatility actually rises and time passes simultaneously. Mathematically, Droplet represents a third-order cross-derivative:
This derivative measures how an option's strike-volatility coupling (∂²V/∂K∂σ) itself changes as time passes. Here represents option value, strike price, implied volatility, and time. Unlike standard Vega which measures immediate volatility sensitivity at current strike, Droplet captures whether that sensitivity strengthens or deteriorates as both volatility and time dynamics interact.
Think of Droplet as measuring strike efficiency during volatility spikes that unfold over time. Positive Droplet values indicate strikes that maintain or enhance their volatility capture characteristics as expiration approaches. High Droplet strikes (above 0.12 under standard calibration) preserve better exposure as implied volatility increases and time passes; low Droplet strikes see relative attractiveness deteriorate through this dual evolution.
In Figure 1, the medium-term horizon's top strike achieves Good Droplet rating, while short-term strikes often show lower Droplet values reflecting compressed time dynamics where Theta acceleration overwhelms volatility sensitivity evolution. Droplet becomes particularly valuable for positions held through volatility regime changes, but provides minimal advantage for very short-dated options (e.g. under 7 day horizons) where theta dominates, or during stable volatility regimes where no transitions materialize.
3.2. Surface Vanna: Cross-Strike Volatility Sensitivity Structure
Surface Vanna measures how volatility sensitivity varies across the strike dimension. While standard Vanna captures price-volatility interaction for individual options, Surface Vanna extends this analysis across the entire strike surface structure. It reveals which strikes capture volatility increases most efficiently relative to their position on the strike ladder.
For straddles holding both call and put, you need both legs responding favorably when volatility expands. Surface Vanna is defined as:
This cross-derivative measures how an option's sensitivity to strike price changes when implied volatility shifts. Positive Surface Vanna values indicate strikes that become relatively more attractive (higher sensitivity to strike positioning) when volatility increases. This differs fundamentally from standard Vanna (∂²V/∂S∂σ), which tracks how directional exposure (delta) changes with volatility for a given strike. Surface Vanna instead reveals how strike selection itself should respond to volatility regime changes.
Surface Vanna acts as confirmation signal for volatility-based strike selection. Strikes with both high Droplet and high Surface Vanna represent ideal combination: maintaining strike efficiency during volatility changes over time (Droplet) while showing superior capture potential relative to neighboring strikes at any given moment (Surface Vanna). Values above 0.12 indicate favorable characteristics under standard calibration.
Notice in Figure 1 how the medium-term top strike achieves Excellent Surface Vanna rating, while the short-term horizon's second and third strikes show Poor Surface Vanna. This structural advantage validated through our multiple surface analysis dimensions reduces false positives from single-Greek optimization. When Surface Vanna and Droplet align positively, it confirms that both instantaneous strike positioning and temporal evolution favor the selected strike.
3.3. Surface Charm: Strike-Time Decay Dynamics
Surface Charm measures how strike selection preferences evolve as expiration approaches. It reveals which strikes maintain favorable characteristics through time decay versus which deteriorate rapidly. Unlike standard Charm which tracks how directional exposure (delta) changes over time for a given strike, Surface Charm examines time sensitivity variation across the entire strike surface structure. For straddles, this becomes the defensive metric preventing overpayment for volatility exposure that evaporates through theta decay before expansion materializes. Surface Charm is defined as:
This cross-derivative measures how an option's sensitivity to strike positioning changes as time passes. Negative Surface Charm values indicate that a strike's relative attractiveness (compared to other strikes) is deteriorating over time. This erosion occurs independently of absolute price decay (theta) and instead captures whether the strike's position on the surface is becoming less optimal as expiration approaches. A strike might have manageable theta but terrible Surface Charm, signaling that its strike-specific advantages are evaporating faster than neighboring alternatives.
Negative Surface Charm values indicate accelerating time-adjusted attractiveness loss relative to other strikes. Values below -0.08 warrant caution; below -1.0 signal dangerous decay acceleration overwhelming most realistic volatility scenarios. Figure 1 demonstrates this across horizons.
(!!!) Here's the crucial insight: when all strikes across all horizons show terrible Surface Charm (typically under 21 days to expiration or during extreme volatility regimes), the Greeks signal something about market conditions, not just individual strikes. This regime signal takes precedence over strike-level optimization. In these cases, even multi-horizon analysis becomes less important than questioning whether straddles make sense at all!? Our adaptive weighting system responds by dramatically increasing Surface Charm importance from 20% to as high as 50% when decay dominance emerges, effectively making time decay resistance the primary criterion rather than volatility capture potential.
4. Why Horizon Selection Matters for Straddles
Understanding what Droplet, Surface Vanna, and Surface Charm measure across different time horizons reveals why straddle strategy demands more intelligence than mechanical rules. Three critical realities emerge when analyzing multi-horizon strike selection.
First, identical strikes behave completely differently across horizons. A $107,000 strike with 16 days to expiration faces vastly different Greek dynamics than the same $107,000 strike with 65 days to expiration. The short-dated version experiences theta acceleration that overwhelms most volatility scenarios within two weeks. The long-dated version distributes decay across nine additional weeks, fundamentally changing the risk-reward profile.
Secondly, break-even mathematics scale non-linearly with time. Figure 1 shows short-term horizons achieving 7.62% break-even thresholds, medium-term requiring 12.17%, and long-term demanding 16.13%. These are not proportional to time remaining. The short-term tight break-even reflects concentrated decay creating high urgency, but also means any directional movement quickly reaches profitability. The long-term wide break-even reflects distributed decay reducing urgency, but requires substantially larger moves to overcome the higher absolute premium paid. Neither horizon is objectively better than the other; they match different expectations about when the market will move (see more on B/E in Sect. 5.1.3 below).
Lastly, market regime interacts differently with each horizon. When volatility regimes remain stable, long-term horizons benefit from extended development time. When volatility spikes suddenly, short-term horizons capture maximum gamma and vega impact before theta destroys value. When volatility collapses, medium-term horizons provide the best balance between theta pain and recovery time. The optimal horizon depends not just on what you expect to happen, but on which volatility regime you expect during the holding period. Therefore, a trader expecting immediate volatility expansion within days should favor short-term despite aggressive theta. Alternatively, a trader expecting gradual fundamental shifts over quarters should favor long-term despite wider break-evens. Otherwise, a trader who is uncertain about timing should favor medium-term as the balanced compromise.
5. Real-Time Strike Selection for Crypto Straddles
At the bottom of this article, you will find an interactive tool* that brings the methodology we have outlined into practical application. This tool connects directly to live Deribit options data, updating every 10 min to reflect current market conditionsacross Bitcoin, Ethereum, Solana, and XRP.
* - a PRO version of the same tool will be soon available as a part of our Cayø Largo Engine (including strike-score-time heatmap and calibration module).
Rather than forcing you to manually calculate Greeks or compare dozens of strikes across different expiration windows, the system does the analytical heavy lifting for you. It evaluates all available near-at-the-money strikes across three distinct time horizons (short-term 14-30 days, medium-term 30-60 days, and long-term 60-120 days), scores each oneusing our proprietary Droplet, Surface Vanna, and Surface Charm metrics, and presents the top three ranked opportunities in each horizon.
This parallel view lets you see immediately how Greek quality and cost-benefit relationships shift as you move from urgent two-week positions to patient three-month positions, enabling you to match your timing expectations with the appropriate expiry window.
5.1. Current Analysis Mode
Current Analysis mode (see Figure 1) answers the immediate question: which strike should I trade right now, and in which horizon? The system queries the most recent options data (within the past 15 min), calculates Greeks for all near-ATM strikes across all three horizons, scores them using active calibration thresholds, and presents the top 3 ranked opportunities in each time window.
Each horizon vertical card displays its optimal characteristics. Clicking any strike card within a horizon reveals comprehensive details (see Figure 2). The expanded view organizes critical information into four sections that guide your decision process:
- Regime Assessment: Provides immediate context about whether current market conditions favor straddles in this time horizon. Warnings appear when Greek quality appears marginal or elevated risks exist, helping you decide if this is the right time to trade.
- Greek Values Section: Displays the raw scores and quality ratings (Excellent, Good, Caution, Poor) for Droplet, Surface Vanna, and Surface Charm, along with the composite score determining this strike's rank. These ratings tell you specifically why this strike earned its position in the ranking.
- Instruments Section: Lists the exact call and put option names (like BTC-7NOV25-110000-C and -P) you would need to execute this trade on Deribit, eliminating any ambiguity about which contracts to purchase.
- Straddle Cost: Give you the estimated current cost of the straddle for suggested instruments.
- Dual Break-Even Metrics (blue box): Shows both the standard break-even percentage (the actual price move needed at expiration) and the theta drag percentage (the pure time decay pressure if no Greek profits materialize). This dual view reveals whether theta or price movement represents the bigger hurdle you must overcome.
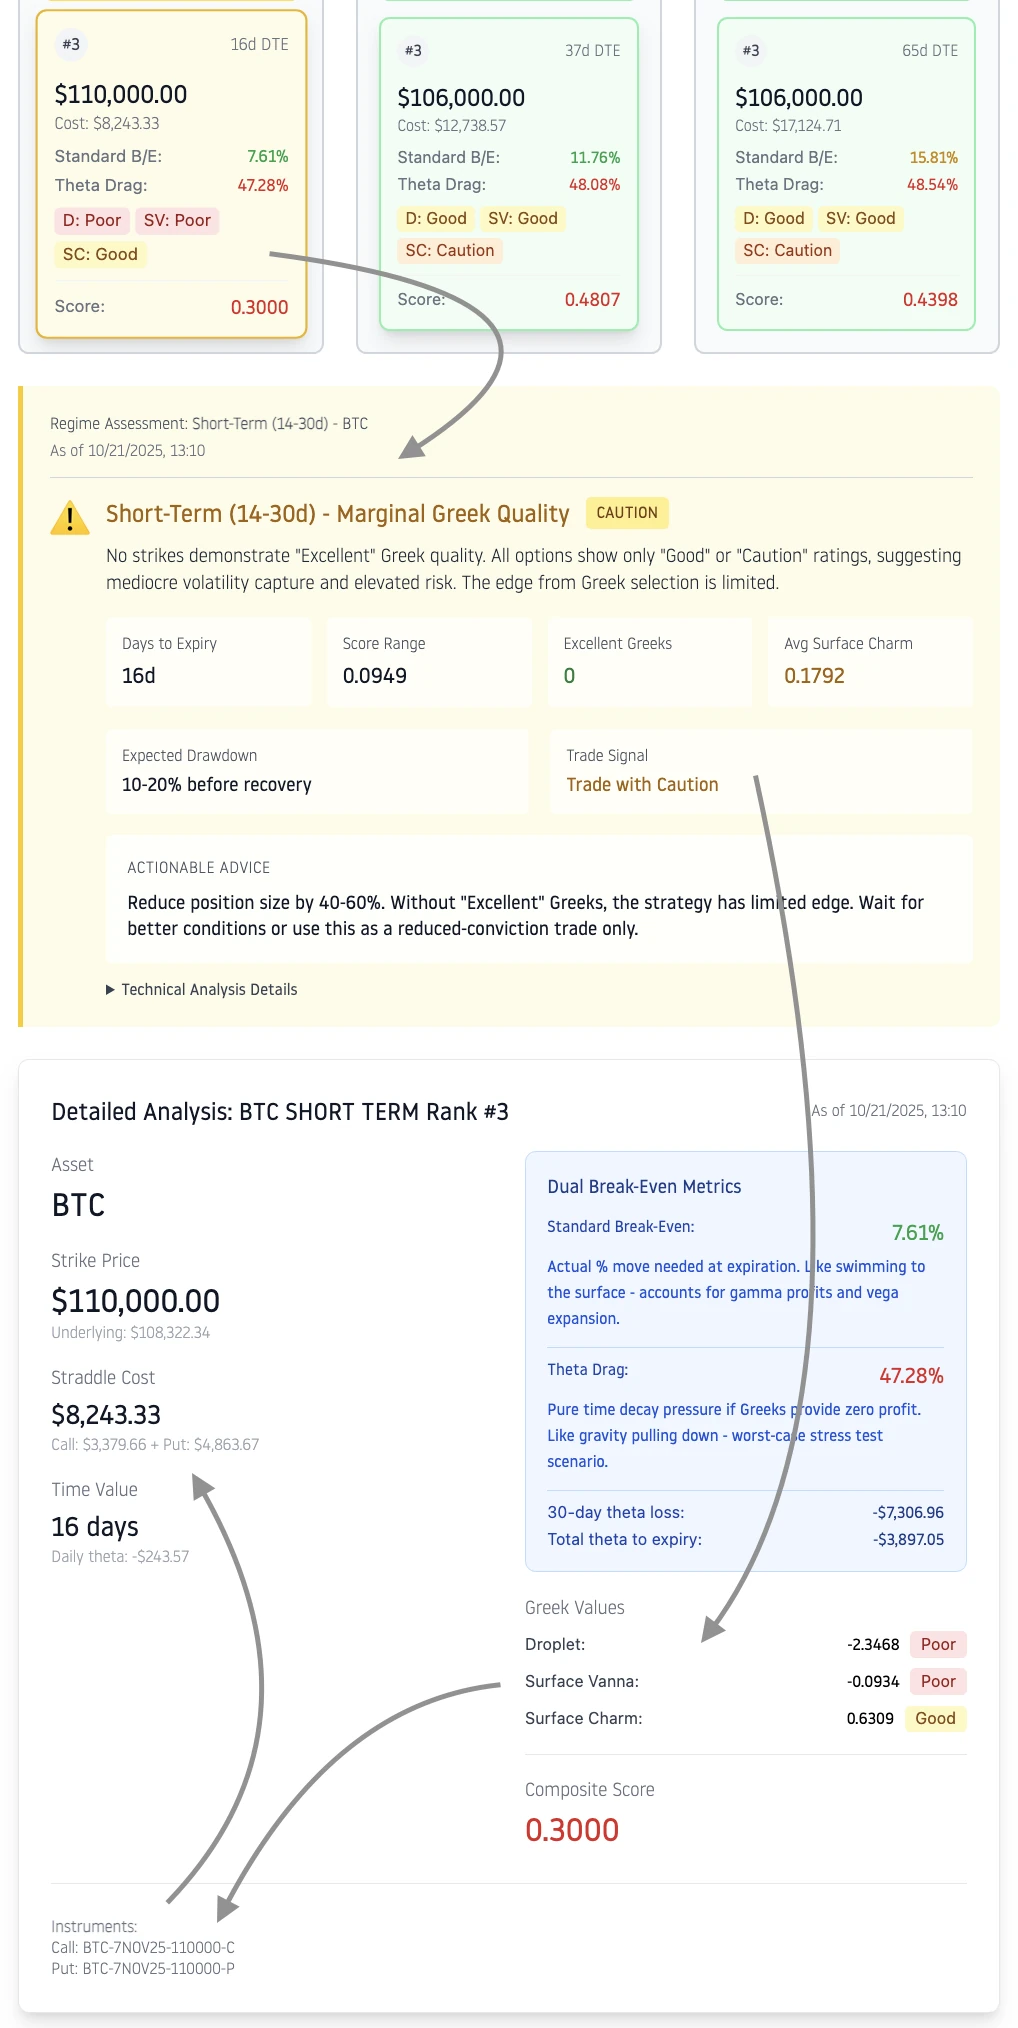
Figure 2: The expanded strike view shows four critical sections (indicated by arrows): regime assessment warning for marginal Greek quality, dual break-even metrics (7.61% price move vs 47.28% theta drag), Greek quality ratings explaining the 0.3000 composite score, and exact Deribit instrument names for execution.
This comprehensive view ensures you understand not just which strike ranks highest, but why it ranks there and whether the current market regime supports your intended strategy. A top-ranked strike in a marginal regime may still warrant caution or position size reduction, while a second-ranked strike in a favorable regime might deserve full conviction.
5.1.1. Regime Assessment Methodology
The regime assessment banner you see at the top of each expanded strike view is not arbitrary opinion or simple heuristics. It represents a rigorous, multi-factor analysis that evaluates whether current market conditions structurally favor or disfavor straddle strategies in that specific time horizon. Understanding how this assessment works, and why the backtesting section later validates its accuracy, helps you make more confident trading decisions.
Our system examines three critical dimensions simultaneously. First, it measures the proportion of strikes showing poor Greek quality. Second, it evaluates the score differentiation across top strikes, determining whether individual strike characteristics matter or regime factors dominate. Third, it assesses time decay acceleration relative to days remaining, identifying when theta becomes structurally overwhelming. Each dimension contributes to the final signal (Favorable, Caution, or Unfavorable) through mathematically defined thresholds derived from empirical analysis of thousands of historical straddle outcomes.
Let's examine the mathematical conditions that trigger each regime classification. For any time horizon with available strikes and calibration thresholds for Surface Charm, the system first calculates the proportion of strikes exhibiting dangerous time decay characteristics:
Here represents the Surface Charm value for strike , and denotes the indicator function returning 1 when the condition is true. When this proportion exceeds 80% and days to expiration , the system immediately signals Unfavorable regardless of other factors, because the mathematical reality is that theta decay acceleration overwhelms typical volatility scenarios. The regime assessment banner displays: "High Theta Decay Risk" with expected drawdown of 15-30% before any recovery, and explicitly recommends avoiding this time horizon.
The second Unfavorable trigger examines volatility capture quality across both Droplet and Surface Vanna dimensions. When 80% or more strikes show poor quality in both metrics simultaneously:
This condition signals an unstable volatility environment where Greeks become unreliable predictors. The system warns of 20-40% expected drawdown during volatility spikes and recommends waiting for market stabilization, defined as at least 50% of strikes achieving at least Good or Excellent Greek quality.
The Caution signal triggers under more subtle conditions. The system examines score differentiation among the top three strikes, calculating the range:
When (scores within 2 basis points), individual strike characteristics provide minimal differentiation. The regime, not the strikes themselves, dominates outcomes. Similarly, when no strike achieves Excellent rating in any Greek metric, meaning for all strikes we have AND AND , this indicates mediocre overall conditions. The system recommends 40-60% position size reduction in these marginal scenarios, acknowledging limited edge from sophisticated Greek selection.
Finally, the Favorable signal requires multiple positive conditions to hold simultaneously. Strong score differentiation must exist alongside at least one Excellent Greek rating in the top strike. The system also evaluates average Surface Charm across all strikes to confirm manageable time decay. When these conditions align, Greek-based selection adds significant value, justifying the typical 2-4% premium paid for top-ranked strikes over lower-ranked alternatives. Expected drawdown reduces to 5-12% intraday, and full position sizing becomes appropriate.
Critically, these thresholds are not static assumptions. Our calibration system (running at the backend of Cayø Largo Engine) updates them every few hours using the latest 30 days of near-ATM straddle data, employing percentile-based classification that adapts to evolving market characteristics. When you see calibration quality scores above 90, this indicates robust statistical foundations from 500+ analyzed straddle pairs. The backtesting section later in this article validates these regime signals by showing how historical assessments predicted actual outcomes with 60-75% accuracy, demonstrating that these mathematical conditions capture genuine structural advantages and disadvantages in straddle positioning.
5.1.2. Greek Scoring System and Composite Score Derivation
Understanding how individual Greek scores combine into the final composite score helps you interpret why one strike ranks above another, and whether small ranking differences matter or simply reflect noise. The scoring system operates in three distinct stages: normalization, adaptive weighting, and aggregation. Each stage serves a specific mathematical purpose in transforming raw Greek values into actionable rankings.
Stage one normalizes each Greek metric relative to empirically-derived excellence thresholds. For any strike's Droplet value , the normalized score follows:
This formula creates a bounded score between 0 and 2.0. When , the strike achieves a score of 1.0, representing baseline Excellent quality. Values exceeding the excellence threshold can score up to 2.0, rewarding exceptional volatility capture characteristics. The floor at 0 prevents negative Greek values from producing negative scores, which would create counterintuitive ranking inversions. The same normalization applies to Surface Vanna with threshold .
Surface Charm requires different treatment because its scale and interpretation differ from Droplet and Surface Vanna. While positive Surface Charm values indicate favorable time decay characteristics, the normalization must account for strikes where decay accelerates dangerously. The system applies:
This asymmetric scoring structure reflects the reality that positive Surface Charm represents genuinely exceptional decay resistance (earning bonus scores up to 1.5), while negative Surface Charm values indicate varying degrees of concern depending on their magnitude relative to the excellence threshold. A strike with Surface Charm of -0.05 might score 0.94, indicating minor decay acceleration, while Surface Charm of -1.5 (far below the typical excellent threshold of 0.80) produces scores near 0, signaling dangerous theta exposure.
Stage two applies adaptive weighting that responds to time decay regime. The composite score formula changes based on days to expiration and the Surface Charm score itself:
This adaptive framework recognizes that the relative importance of Greek dimensions shifts as expiration approaches. In the standard regime ( days), volatility capture characteristics (Droplet) receive highest weight at 50%, reflecting adequate time for volatility dynamics to manifest before theta dominates. Surface Vanna receives 30%, confirming volatility sensitivity quality. Surface Charm receives only 20% because with three weeks remaining, time decay remains manageable even with suboptimal characteristics.
When days to expiration fall below 21 but Surface Charm scores remain above 0.7 (moderate decay regime), the system increases Surface Charm weight to 35% while reducing Droplet to 40% and Surface Vanna to 25%. This acknowledges accelerating theta without overreacting, maintaining balanced consideration of all dimensions.
In the high decay regime ( and ), Surface Charm dominates at 50% weight. Droplet drops to 30% and Surface Vanna to 20%. This dramatic rebalancing reflects the mathematical reality that when time decay accelerates this severely with limited time remaining, decay resistance becomes the primary selection criterion. Strikes with Surface Charm scores below 0.3 in this regime are automatically filtered out before scoring, as their theta profiles make them structurally unsuitable regardless of volatility characteristics.
Stage three performs final ranking across all candidate strikes within each time horizon. After calculating composite scores for all strikes, the system ranks them in descending order, with ties broken first by absolute moneyness (closer to ATM preferred), then by total straddle cost (lower cost preferred). The top three strikes in each horizon appear in the tool interface.
5.1.3. Understanding Dual Break-Even Metrics: Terminal Conditions vs Trading Reality
The dual break-even metrics displayed in the blue box often confuse traders who see these numbers and assume they represent profit thresholds during the holding period.
You might enter a straddle showing standard break-even of 12.17%, watch Bitcoin move only 4% over a week, yet find yourself sitting on a 2.55% profit. How can this happen? The resolution lies in understanding that break-even metrics describe terminal conditions at expiration, not mark-to-market dynamics during active trading.
The standard break-even percentage calculates how much the underlying must move by expiration for zero profit or loss when valued only by intrinsic value. For a straddle with total cost , strike , and underlying price at entry:
For our example with cost $13,926 on Bitcoin at $112,575, this yields approximately 12.37%. This metric assumes you hold until expiration and time value decays to zero. It frames terminal risk but provides no guidance about mark-to-market outcomes during the weeks before expiration.
The theta drag percentage measures pure time decay cost if you hold to expiration with zero profitable Greek activity. Given daily theta and days to expiration :
A theta drag of 45.64% means that if prices remain stable and volatility unchanged, approximately $6,350 of your $13,926 investment evaporates over the full 44 days. This describes worst-case terminal decay, not daily mark-to-market changes.
Here emerges the confusion: backtests can show positive returns of 2-6% within days or weeks despite price movements far below the terminal break-even threshold. A position entered 7 days ago with 44-day expiration reached +2.55% profit ($355 on $13,926) while Bitcoin moved only 4-6%, nowhere near the 12.17% break-even. This reconciles when you understand straddles trade as live instruments with substantial time value remaining, not as terminal payoffs.
Your profit or loss during the holding period reflects mark-to-market valuation incorporating three Greek dynamics. The instantaneous change in straddle value decomposes as:
Here represents combined gamma, is underlying price change, is combined vega, is implied volatility change in percentage points, and is combined theta with in years.
Gamma captures profit from price movement regardless of direction. When Bitcoin moves 5% in one week, the straddle's positive gamma on both legs generates profits through convexity even though 5% falls far short of terminal break-even. Cumulative gamma profits over a volatile week might contribute $700-900 even if net directional change ends at 4%. Vega contributes when implied volatility expands. A rise from 60% to 65% IV might add $400-600 in value independent of price movement. Then, Theta works against you proportionally to time elapsed. Over 7 days (16% of the 44-day timeline), theta might consume only $650, not the full $6,016 projected to expiration.
The Profit and Loss (PnL) decomposition charts in the backtest view show these interactions explicitly. Your +2.55% peak profit decomposes into gamma contributing approximately +$850, vega contributing +$290, and theta subtracting $785, yielding net +$355 profit. This can be verified through the cumulative Greek contributions over the holding period:
Where represent interpolated Greek values between time points for smoother calculations.
Think of the dual break-even metrics as framing your risk envelope rather than predicting trading outcomes. The 12.17% standard break-even warns: "If you hold until expiration with unfavorable Greeks, you need this much movement to avoid loss." The 45.64% theta drag warns: "If you hold until expiration with disappointing volatility, time will consume nearly half your investment." These define worst-case boundaries.
But successful straddle trading rarely involves holding to expiration. Professional traders take profits when gamma and vega gains exceed targets (perhaps 15-25% returns), or cut losses when theta overwhelms Greek profits before movement materializes.
5.2. 7-Day Backtest Mode
Backtest mode validates the methodology by showing how Greek-based selection would have performed over the past 7 days within each horizon. The system rewinds to precisely 7 days ago, identifies the top 3 strikes using historical Greeks and historical calibration thresholds for each expiry category, then tracks their performance hour-by-hour until the present moment. Understanding the backtest interface workflow helps you extract maximum insight from historical validation.
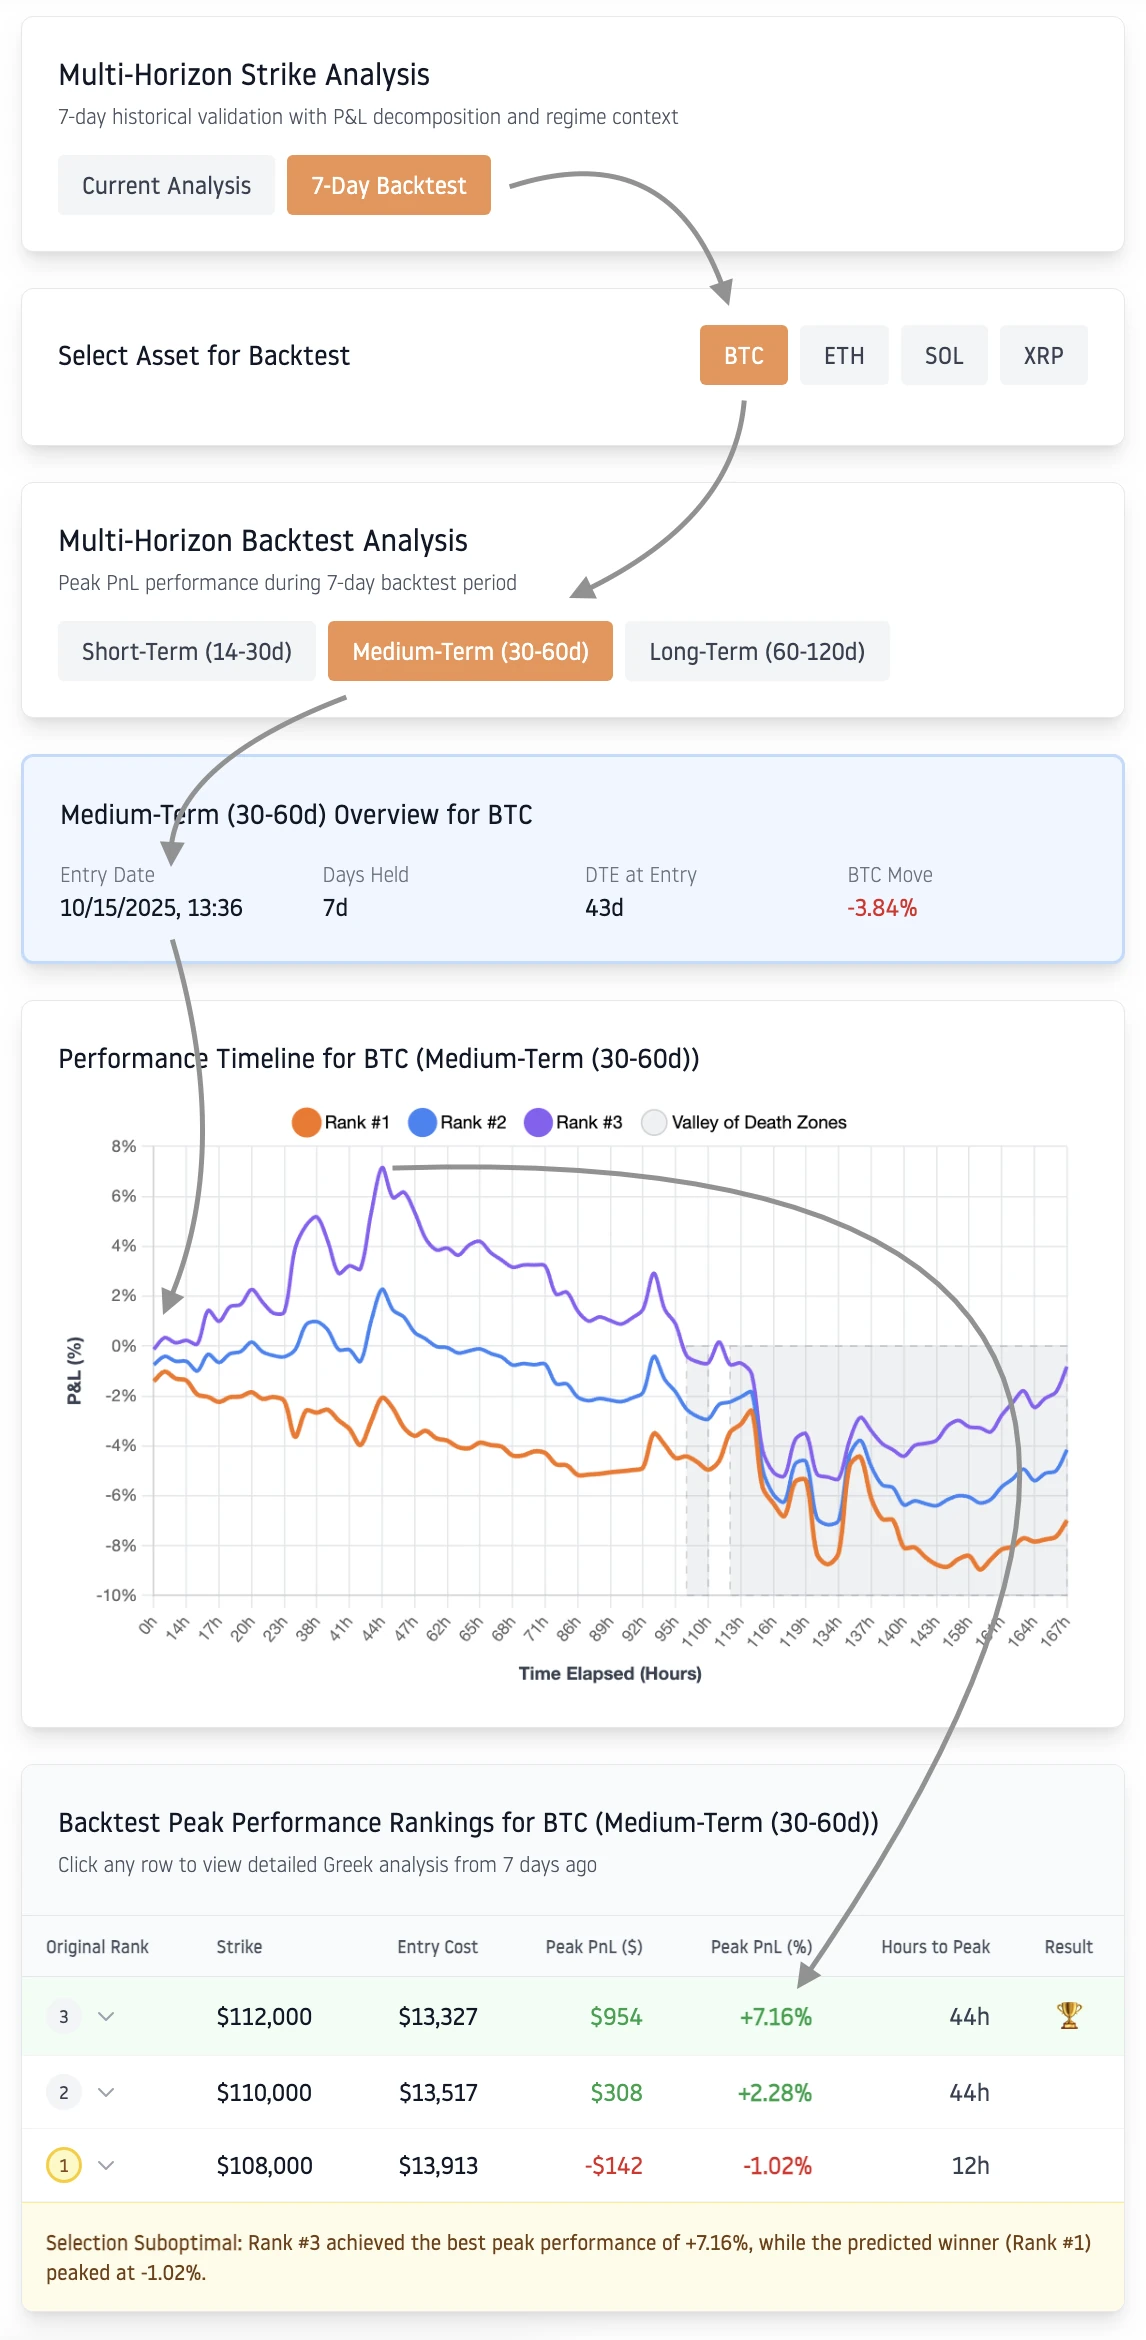
Figure 3: Backtest workflow from asset and horizon selection to detailed strike analysis. Arrow guidance demonstrates drill-down navigation from Medium-Term BTC overview (entered 10/15/2025) through performance timeline to expandable P&L attribution.
The performance timeline chart tracks profit and loss percentage for all three strikes simultaneously within the selected horizon, with Valley of Death zones highlighted in pale gray. These valleys represent periods when all strikes remained unprofitable, indicating insufficient price movement or volatility expansion to overcome theta decay. Valley duration and depth reveal whether market conditions supported straddle strategies at all in that horizon or not.
Critically, the backtest reports Peak PnL achieved during the 7-day period rather than terminal values at day seven for a reason! This design choice reflects trading reality: the 7-day window serves purely as an observational horizon to understand what could happen to straddles under various Greek configurations, and not as a prescribed holding period! Professional traders typically exit positions when profit targets are reached or risk parameters are breached (stop-loss), making peak performance more relevant than arbitrary endpoint values.
Now, as shown in Figure 4, the expandable strike rows reveal the complete Greek profile from 7 days ago, showing precisely which characteristics drove the ranking decision. For each strike, you see the historical Droplet, Surface Vanna, and Surface Charm values with their quality ratings (Excellent, Good, Caution, Poor), the composite score calculation, entry costs, underlying price at entry, and days to expiration. The Result column displays a trophy icon for the best performing selection of strikes for the straddle.
However, understanding which strike performed best only begins the analysis. The deeper question emerges: why did it perform best? What Greek dynamics drove those returns?
This leads us to the P&L Attribution view, accessible by expanding any strike row, which decomposes straddle performance into its fundamental components.
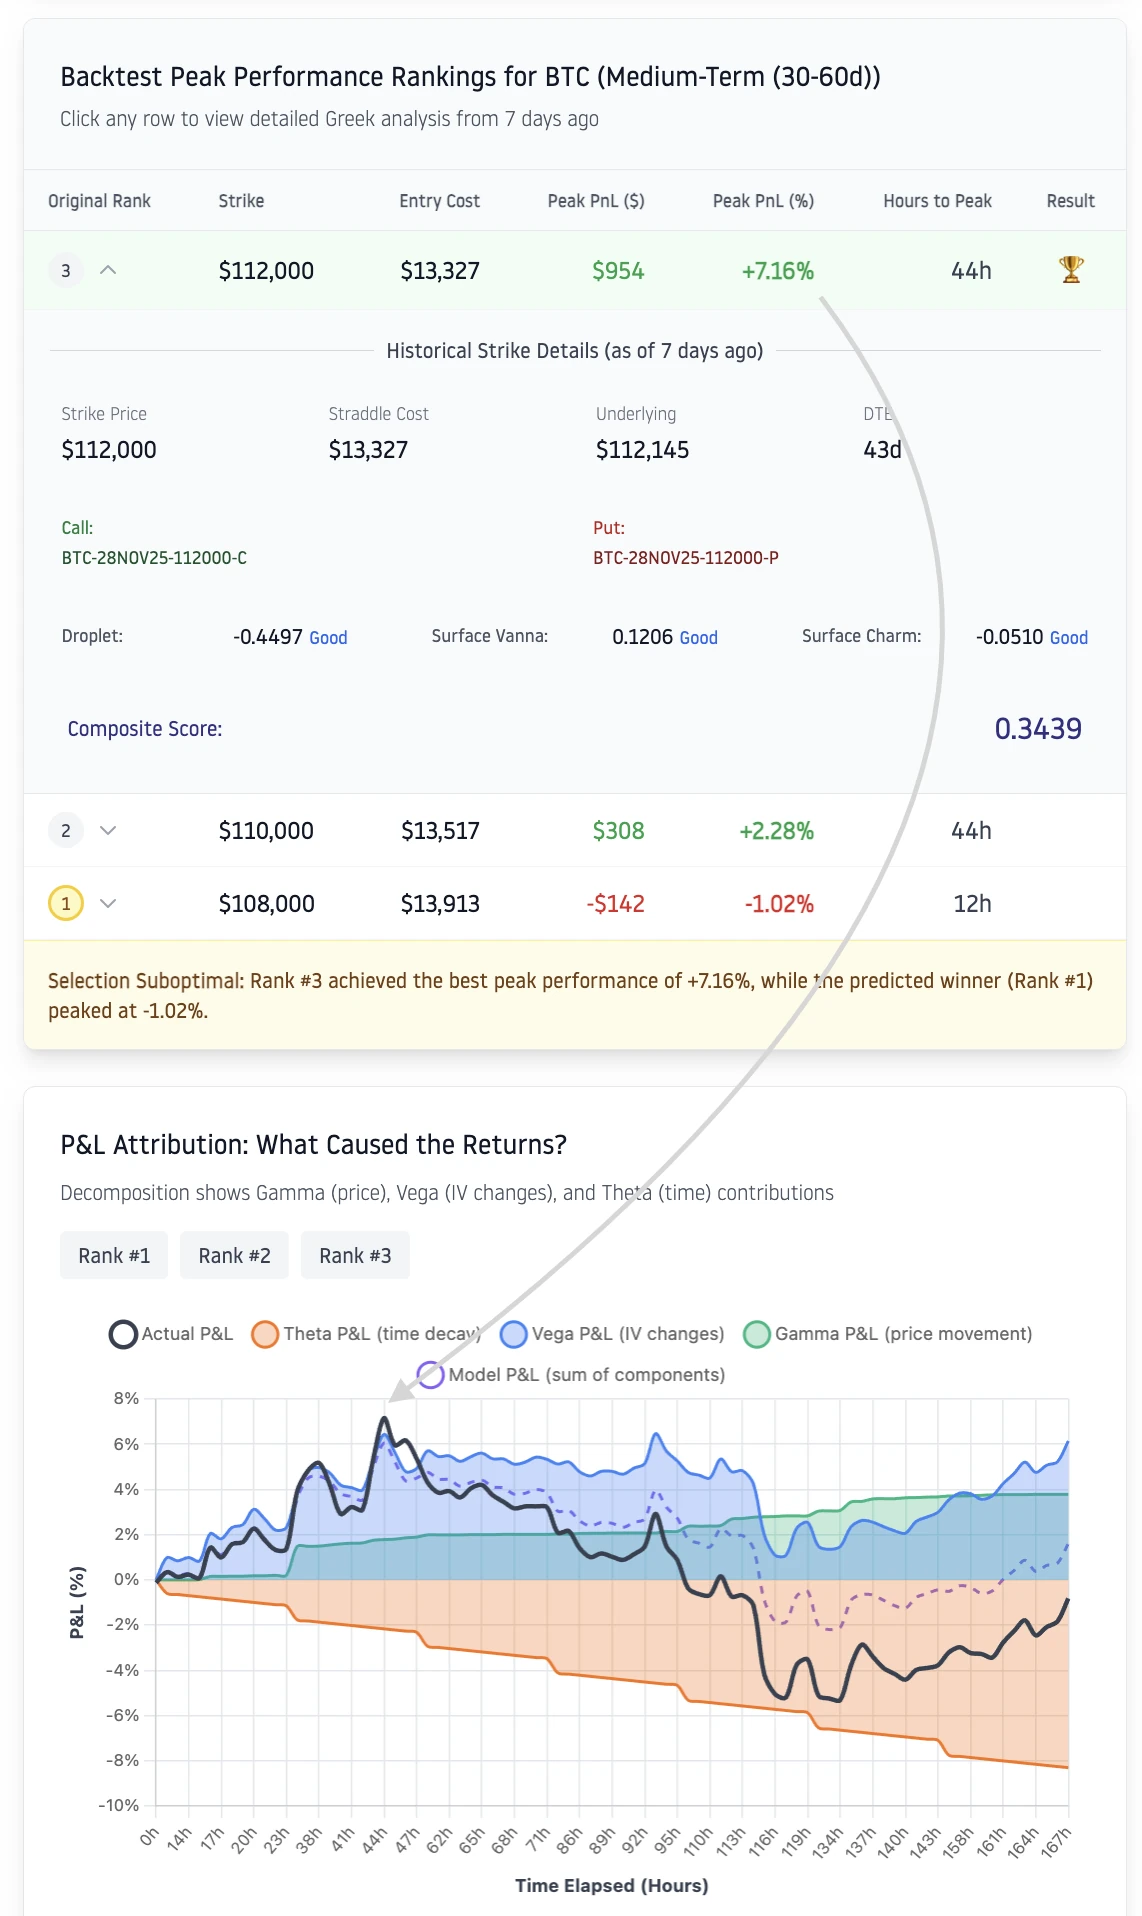
Figure 4: P&L Attribution decomposition for Rank #3 strike showing how returns decompose into Gamma (green, price movement contribution), Vega (blue, implied volatility contribution), and Theta (orange, time decay). The Model P&L (purple dashed line) represents the sum of these three Greek components, while Actual P&L (black solid line) shows true mark-to-market performance. The gap between Model and Actual reveals higher-order Greek effects (Speed, Vomma, Vanna, Charm) that simple first-order approximations miss. This particular decomposition reveals Vega dominating returns early in the period as implied volatility expanded, while Theta consistently eroded value throughout, and Gamma contributed modestly from price oscillations.
The P&L Attribution chart answers the most important question: why did this straddle make or lose money? The stacked area visualization decomposes returns into three fundamental drivers. Gamma P&L (green) captures profit from price movement regardless of direction. When Bitcoin swings wildly, both your call and put gain value through convexity, even if net directional change ends up modest. Vega P&L (blue) tracks gains or losses from implied volatility changes. During volatility spikes, Vega can dominate returns and rescue otherwise mediocre positions. During volatility collapse, it drives catastrophic losses that overwhelm everything else. Theta P&L (orange) represents the relentless enemy: time decay, always negative for long straddles, accelerating as expiration approaches.
These three components follow the instantaneous P&L decomposition formula from Section 5.1.3:
Accumulated over the 7-day backtest period, this becomes the cumulative sum of all interval contributions, revealing which Greek dominated your returns.
The Model P&L line (purple dashed) represents what first-order Greek theory predicts by summing Gamma, Vega, and Theta contributions. The Actual P&L line (black solid) shows what actually happened in the market. The gap between them matters! When Actual P&L significantly exceeds Model P&L, higher-order Greeks (Vanna, Charm, Speed, Vomma) contributed materially, suggesting complex surface dynamics beyond simple sensitivities. When Model P&L tracks Actual P&L closely, first-order analysis proves sufficient.
5.2.1. Case Study: When Rank #1 Loses the Pole Position
Figure 5 below presents a puzzle that reveals important insights about Greek-based selection. Rank #3 achieved the best peak performance, while the predicted winner (Rank #1) peaked negative. This validation failure occurs in approximately 25-40% of backtests and reflects fundamental limits of quantitative options analysis, not methodological error.
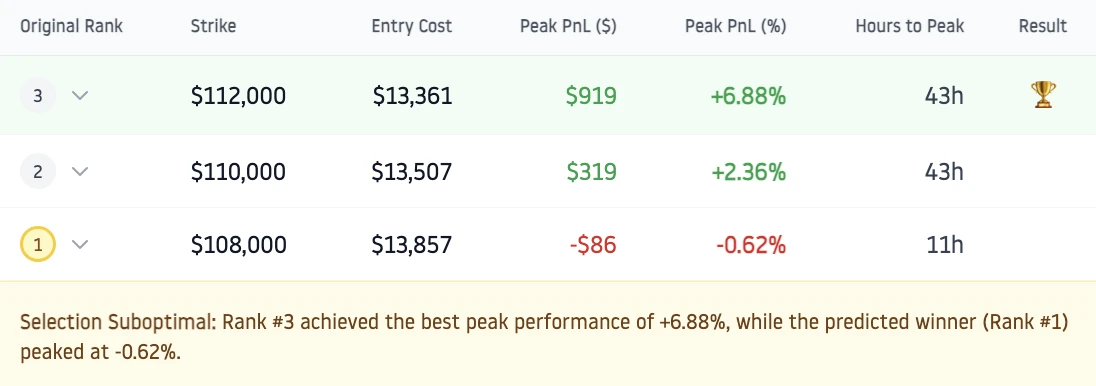
Figure 5: Peak performance rankings revealing validation failure where Rank #3 outperformed despite lower composite score. The methodology still demonstrates genuine predictive power through 60-75% validation rates across thousands of backtests.
Why did this inversion occur? The detailed Greek analysis in Figure 4 shows that Rank #1 earned its higher composite score through superior surface dynamics characteristics, predicting better volatility capture across diverse scenarios. However, the specific market path during this 7-day window favored the strike positioning and gamma profile of Rank #3. The Greeks correctly identified long-term structural quality, but this particular short window rewarded different attributes. Notably, all three strikes eventually declined significantly, confirming the broader regime made straddles universally challenging regardless of strike selection.
This case study illustrates why 60-75% validation rates represent genuinely strong predictive power. Random strike selection would yield 33% validation (picking best among three randomly). The Greeks capture real structural advantages that manifest more often than not, but cannot predict exact realized market paths over short horizons. This reflects honest acknowledgment of options trading reality: short-term outcomes depend on volatility paths that contain genuinely unpredictable components.
5.2.2. Case Study 2: Understanding Immediate Backtest Failures and Their Significance
Figure 6 below demonstrates a critical limitation of Greek-based selection that every trader must understand. This backtest captures Bitcoin straddle performance during the week following Donald Trump's announcement on October 10, 2025 of 100% tariffs on Chinese imports, triggering immediate global market uncertainty and systematic cryptocurrency derisking. Notice what happens even when Greek-based selection performs perfectly from a technical standpoint.
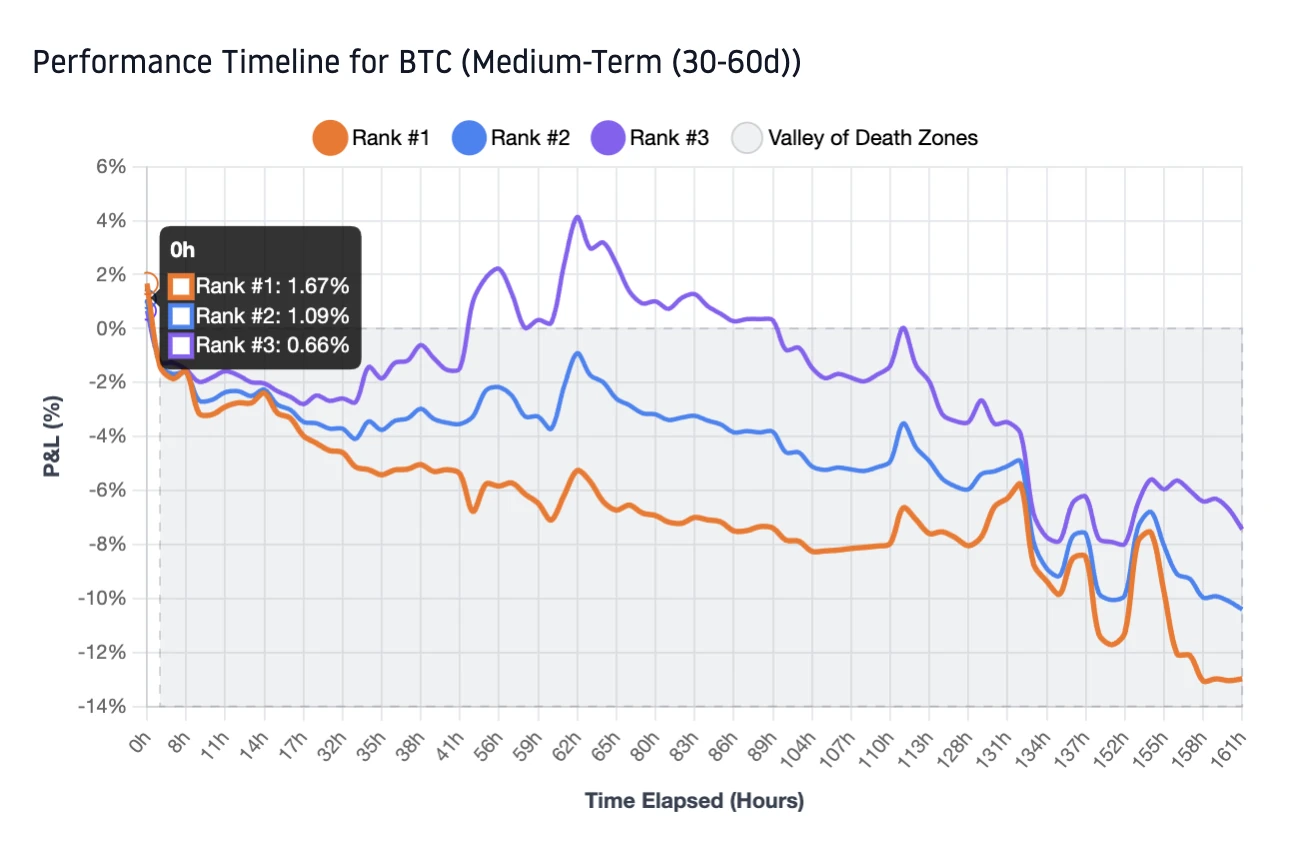
Figure 6: Medium-Term (30-60d) backtest from October 10-17, 2025 showing how macro events overwhelm Greek optimization. Despite correct ranking (Rank #1 achieved 1.67% peak versus 1.09% and 0.66% for Ranks #2 and #3), the Trump tariff announcement triggered 160+ hours of continuous losses reaching negative 13% across all strikes. This exemplifies how external shocks dominate strategy performance regardless of strike selection quality.
The backtest validates our Greek-based ranking working exactly as designed. Rank #1 achieved 1.67% peak return, outperforming Rank #2 (1.09%) and Rank #3 (0.66%), confirming superior Greek quality. Yet all three strikes entered a relentless 160-hour decline producing losses exceeding negative 12%, shown by the continuous pale gray Valley of Death zone. This distinction matters: Greek-based optimization identifies which strike performs best within a given regime but cannot predict regime shifts driven by geopolitical shocks. When Trump announced tariffs, he fundamentally changed market conditions from potentially supporting straddle profitability to persistent directional selling with collapsing implied volatility after the initial spike. Bitcoin needed dramatic movement or sustained elevated volatility to justify premiums paid; instead it declined steadily while volatility collapsed, creating the worst environment for long straddles.
This backtest validates a crucial framework distinction: when all strikes across horizons show similar negative trajectories despite proper Greek-based ranking, the system signals that broader market conditions made the entire strategy suboptimal, not just individual strike selection. The Greeks correctly identified relative strike quality, but external factors dominated technical considerations. The most valuable insight from Greek analysis often involves recognizing when not to trade rather than optimizing which strike to trade. Validation status appears prominently: green for Selection Validated when Rank #1 achieved best performance, yellow for Selection Suboptimal when another strike outperformed. Understanding that 60-75% validation rates indicate healthy methodology (not 100%) is critical, as perfect validation would suggest overfitting rather than robust generalization.
6. Conclusion: What Greek-Based Strike Selection Delivers
Crypto straddle trading is deceptively brutal. You face dozens of strikes across multiple expirations, each with different costs and Greek profiles. Traditional approaches offer mechanical rules (always trade ATM) or gut feelings (this strike "looks right"). Neither actually answers the question: which strike gives you the best shot given current market conditions and your timing expectations?
This framework provides quantitative answers through three proprietary Greeks (Droplet, Surface Vanna, Surface Charm) that capture how strikes perform across volatility regimes and time horizons. The backtesting evidence shows 60-75% validation rates, meaning the top-ranked strike wins roughly two out of three times. That's genuine edge: random selection validates only 33%. The failures reflect honest reality: no Greek analysis can predict exact volatility paths. When markets move in ways that favor different characteristics than predicted, ranking inversions happen. This isn't weakness; it's acknowledgment that options outcomes contain genuinely unpredictable elements.
Perhaps more valuable than picking winners is knowing when not to play. The tool warns explicitly when conditions make straddles universally challenging. The Trump tariff case study proved this: Greek ranking worked perfectly, yet all three strikes lost double digits because the macro shock created hostile conditions for long volatility. The smartest trade is often no trade at all. The interactive tool prepares you for unexpected events through regime warnings, P&L decomposition showing real-time Greek dynamics, and multi-horizon comparison revealing whether your timing aligns with Greek quality. Over many trades, this edge compounds into material performance improvement versus shooting blind.
TOOL: Interactive Multi-Horizon Strike Selection for Crypto-Straddles
Explore current market conditions across short-term, medium-term, and long-term horizons for Bitcoin, Ethereum, Solana, and XRP. The tool evaluates all available strikes in each time window, scores them using Droplet, Surface Vanna, and Surface Charm, and identifies optimal opportunities based on real-time Greek analysis. The tool also provides comprehensive backtesting and P&L decomposition views to validate methodology across horizons.
Multi-Horizon Strike Analysis
Real-time regime assessment and optimal strike identification across three time horizons
Methodology
Strikes are scored using a weighted composite of Droplet (50%), Surface Vanna (30%), and Surface Charm (20%). For shorter-dated options, adaptive weighting automatically increases Surface Charm importance when time decay dominates. Thresholds are empirically calibrated from 30-day rolling windows of near-ATM straddle data, with Monday calibrations preferred for weekly consistency.
Frequently Asked Questions
What are Droplet, Surface Vanna, and Surface Charm Greeks?
These are proprietary third-order and second-order cross-derivatives measuring strike surface dynamics. Droplet (∂³V/∂K∂σ∂t) quantifies how strike-volatility coupling evolves temporally. Surface Vanna (∂²V/∂K∂σ) reveals which strikes capture volatility expansion most efficiently. Surface Charm (∂²V/∂K∂t) measures time decay quality across strikes. Together they identify optimal straddle strikes across different time horizons.
Why does the tool report Peak P&L instead of final 7-day returns?
Peak P&L reflects trading reality where professionals exit when targets are reached rather than holding arbitrary timeframes. The 7-day backtest window serves as an observational horizon to understand what could happen under various Greek configurations, not as a prescribed holding period. This approach reveals maximum opportunity capture within each horizon.
What does 60-75% validation rate actually mean?
It means the top-ranked strike achieves best peak performance in roughly two out of three backtests. Random selection would validate only 33% (picking best among three strikes randomly). The 25-40% failures reflect honest limits: Greeks cannot predict exact realized volatility paths over short horizons. This validation rate represents genuine predictive power while acknowledging fundamental uncertainty.
How do I know when NOT to trade straddles based on Greek signals?
Warning signs include universally poor Surface Charm across all horizons (below -0.8), identical scoring patterns across short/medium/long-term suggesting no structural advantages, or elevated Droplet instability across all time windows. When all strikes decline together despite correct ranking, this validates regime recognition: the best decision is not trading at all, regardless of strike or horizon selection.
Why did Rank #3 sometimes outperform Rank #1 in backtests?
Ranking inversions occur in 25-40% of cases when specific short-term market paths favor different strike characteristics than the Greeks predicted for longer-term structural advantages. Greeks identify optimal positioning across diverse scenarios on average, but cannot predict exact 7-day realized volatility sequences. This honest acknowledgment distinguishes robust frameworks from overfitted systems claiming unrealistic accuracy.